Key Takeaways
- Frame it as working capital release, not a maintenance tool purchase. It changes which budget it competes in and who sponsors it.
- Use your finance team's own carrying-cost rate. Agreeing that one number up front removes 80% of the argument.
- Include the downtime line even if you present it conservatively. It's what brings operations to your side of the table.
- Present realized-savings measurement (baseline, ERP-verified) in the case itself. It pre-answers the CFO's only hard question.
- The counter-case is the status quo: a seven-figure annual burn is the alternative being approved by default.
Read the full article below to learn more.
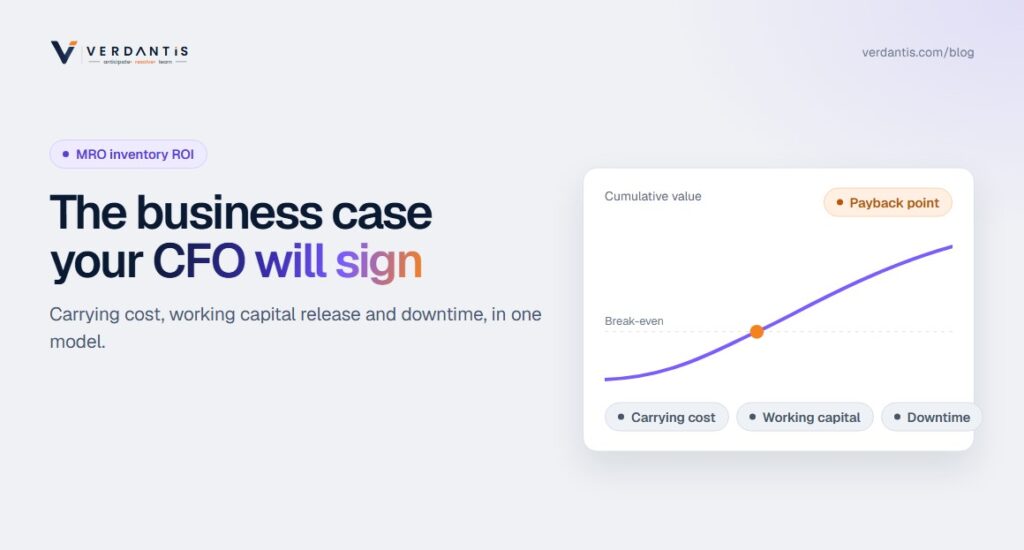
Quick answer: The MRO optimization business case runs on three value lines: annual carrying cost avoided (inventory value × 15-25% carrying rate × the 15-30% reduction target), one-time working capital released (the excess itself), and downtime avoided from protecting under-stocked criticals. On a typical $20M MRO holding, that’s $450K-$1.5M per year in avoided carry plus $3M-$6M released, against a platform cost in the low-to-mid six figures, and payback inside 12 months on the first line alone.






What Goes in the Business Case? The Model, Line by Line
Five lines, in the order a CFO reads them:
The model, line by line, in the order a CFO reads them
| Line | What goes in it | How to calculate or source it |
|---|---|---|
| 1 · Baseline | Total MRO inventory value, frozen at a date, by plant, plus the estimated excess share | Use 20-40% as the industry band for excess until your data assessment replaces it with your real number |
| 2 · Carrying cost avoided (annual) | Inventory value × carrying rate × reduction target | Use your finance team's carrying rate. Most carry 15-25%, covering capital, storage, shrinkage, insurance and obsolescence |
| 3 · Working capital released (one-time) | The excess value itself | Staged across 4-6 quarters as policies take effect and stock burns down or is dispositioned |
| 4 · Downtime avoided (annual) | Parts-driven downtime hours × cost per hour | Applied only to the critical spares the analysis shows are under-protected. Present a conservative and an expected case |
| 5 · Costs (both sides) | Platform and implementation, your SME time, and write-off accounting for obsolete disposal |
Three output metrics matter in the room. The value-to-cost ratio is why these cases clear investment committees when they’re framed correctly.
The output metrics that matter in the room
First-year payback period
When the program has paid for itself.
3-year NPV
The value of the program over three years.
Annual value : annual platform cost
In this category the ratio typically lands between 3:1 and 10:1.
Why Frame It as Working Capital Instead of a Software Purchase?
Because it changes the comparison set.
Pitched as
Maintenance software
- A software platform competes against every other tool request in the plant budget
- It waits its turn
Pitched as
Working capital release
- Releasing $4M of trapped working capital at a 4:1 annual return
- It competes against the company's cost of capital, and wins automatically
The storeroom is a balance-sheet item, and the CFO is the economic buyer.
This framing is also simply more accurate: the storeroom is a balance-sheet item, the program’s primary output is cash and avoided carry, and the CFO (not the maintenance manager) is the economic buyer. Champions who get this framing right walk into a different meeting than the one they feared.
How Do We Make the Downtime Line Credible Instead of Hand-Wavy?
Three rules keep it defensible:
Three rules keep the downtime line defensible
01
Count only parts-driven downtime
Not all downtime: specifically events where the repair waited on a part. Most CMMS/work-order data lets you isolate wait-on-materials hours; even a manual review of last year's top 20 outages produces a defensible base.
02
Apply it only to identified gaps
The claim isn't “optimization ends downtime.” It's “these specific critical spares are under-protected today; here's the exposure.” That's an engineering statement, not a promise.
03
Show a conservative case
Cut your estimate in half and present both numbers. A downtime line that survives a 50% haircut and still matters is more persuasive than a big one that invites attack.
Handled this way, the downtime line does its real job: it makes operations a co-sponsor instead of a skeptic, because their pain is finally in the financial case.
What Will the CFO Push Back On, and What Are the Answers?
Four objections come up, and each has an answer you can bring into the room:
What the CFO will push back on, and the answers
| The pushback | The answer |
|---|---|
| “These savings are theoretical.” | Answer with measurement design: a frozen baseline, realized savings verified in the ERP (stock value actually down, POs actually avoided), reported quarterly. Identified vs realized is the distinction that earns trust; put it in the case before they ask. |
| “We tried inventory reduction before.” | Almost certainly a one-time consulting analysis that decayed. The difference is continuous re-optimization and execution into the ERP: policy changes that keep landing after the kickoff fades. Our reduction playbook covers why programs fail and what sustains them. |
| “What if we cut something we need?” | Criticality-first design: protection on plant-down spares increases while excess falls, and maintenance validates the critical list before any policy changes. See the criticality framework. |
| “Why this vendor?” | Come with the bake-off answer: same extract to every finalist, pre-agreed success criteria, spot-checked results. The alternatives comparison gives the shortlist structure. |
Don't build the model alone
MRO360 runs your extract and returns the business case populated with your real excess numbers, real duplicates and real under-protected criticals, usually inside two weeks.
Get your ROI model built →When Does the Business Case NOT Clear?
Honesty strengthens the page and the pitch. The math gets thin in three situations:
The math gets thin when…
Holdings under roughly $3M
Carrying-cost savings can't cover enterprise platform costs. Fix process instead.
Closure or divestiture inside two years
The site is scheduled to close or be divested before the program pays out.
No SME time, even at 2-4 hours a week
Data programs without an owner fail regardless of ROI.
If none of those apply and your holdings clear eight figures, the case usually isn’t close.
What Does the Timeline to Value Look Like in the Case?
Present it in three phases so finance sees when cash actually moves:
Timeline to value: when cash actually moves
Weeks 1-8
Data connected, analysis complete, validated findings. This is where the assessment replaces estimates with your real numbers.
Months 3-6
First policy waves executed, stock burn-down begins, first realized-savings report against baseline.
Months 6-18
Reduction compounds toward the 15-30% target, obsolete disposition executes on finance's write-off schedule, downtime exposure on criticals visibly closed.
Cash-flow-phased cases survive scrutiny that single-number ROI slides don’t.
Walk into the budget meeting with your own numbers
Send us an extract; we'll return the populated business case (excess, carry avoided, working capital release, payback) built on your data, ready to present.
Request your custom ROI model →Frequently Asked Questions
How do you calculate MRO inventory optimization ROI?
What carrying cost rate should we use for MRO inventory?
Why frame MRO optimization as working capital release instead of a software purchase?
How do you make the downtime savings in the business case credible?
When does an MRO optimization business case not clear?
How long does MRO inventory optimization take to deliver value?
Related reading: MRO Inventory Reduction Playbook · Criticality Framework · Alternatives Comparison