Global gold miner

Five mines, five SAP instances, one view of every spare.

~$26M
working capital released
47%
less emergency procurement
10 wks
to go live, SAP kept
Read the story
Product
Solutions
Customers
Resources
Company
Book a demoGet a free diagnostic

MRO Inventory Optimization Pricing: How Vendors Charge and What It Really Costs to Run

MRO inventory optimization pricing explained: per-plant, per-SKU and inventory-value models, hidden costs, pilots and the payback math for your CFO.
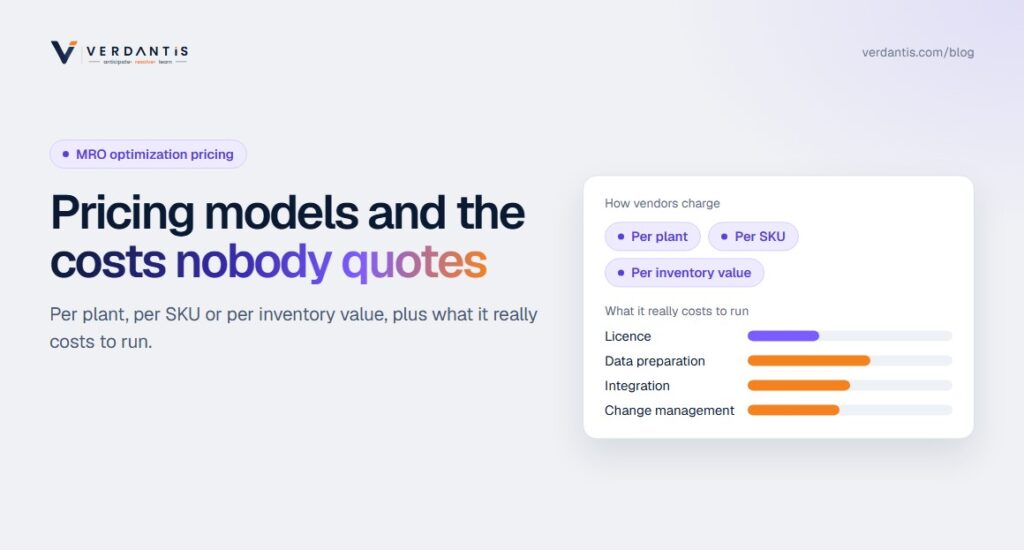
How MRO inventory optimization software is priced: per plant, per SKU and per inventory value, plus hidden costs

Key Takeaways

  • Ask every vendor for total first-year cost: license, implementation, integration and services, not the license line alone.
  • Pricing models differ (per plant, per SKU band, per inventory value); normalize quotes to cost per plant per year to compare.
  • The payback math runs on carrying cost and working-capital release, and it's usually decisive within year one.
  • The expensive option is not the software. It's another year of the storeroom as-is.
  • Pilots should be priced and scoped to convert into deployment, not run as standalone consulting.

Read the full article below to learn more.

Quick answer: Enterprise MRO inventory optimization platforms are priced by plants, SKU volume, or inventory value under management. Implementation ranges from bundled (modern cloud platforms) to services-led engagements (legacy suites). Against a carrying cost of 15-25% per year on MRO holdings, a platform that removes 15-30% of a $20M inventory pays back its first-year cost several times over.
Understand the Real Cost Before You BuyTalk to an MRO specialist about your MRO inventory economics.
Book a non-obligatory consultation call with our delivery team to address master data management challenges
Trusted By Industry Leaders Worldwide
Verdantis customer logoVerdantis customer logoVerdantis customer logoVerdantis customer logoVerdantis customer logoVerdantis customer logo

What Pricing Models Do MRO Optimization Vendors Use?

Three dominate the category:

Three pricing models dominate the category

Model 1

Per plant / site

A platform fee plus a per-site amount. Predictable for multi-plant rollouts, and the easiest model to budget as you scale.

Model 2

Per SKU volume

Banded by active material count. Fair for data-heavy scopes, but ask what happens when rationalization reduces your SKU count: the price shouldn't punish the cleanup.

Model 3

Per inventory value under management

A percentage-of-value logic that aligns vendor incentive with your holdings, though it can get expensive at mining/heavy-industry scale.

Most enterprise quotes blend a platform fee with one of these scaling axes. Whichever model you’re quoted, normalize to cost per plant per year and compare vendors on that number plus first-year services. It strips out the packaging differences.

What Goes Into a Realistic First-Year Budget?

Ask every vendor for total first-year cost: license, implementation, integration and services, not the license line alone. Two structural warnings apply whichever vendor you evaluate:

Two structural warnings

Warning 1

Services-led implementations

Legacy analytics suites often carry services-led implementations that exceed the license. Always ask for total cost of the first 12 months in writing.

Warning 2

“Free pilot” offers

From services-heavy vendors, these usually convert into paid discovery phases. A genuine software pilot runs on standard extracts in weeks, priced to credit against deployment.

What Hidden Costs Should We Budget For?

The quote covers the platform; these four live on your side of the table:

Four costs that live on your side of the table

01

IT time for extracts / integration

Usually small (days) for extract-based starts; larger if you mandate live interfaces on day one.

02

SME time

A materials/storeroom lead, 2-4 hours per week through the first validation quarter: the single most important investment in the program.

03

Change management

Planner training and the governance agreement on who approves policy changes. Cheap in money, decisive in outcomes.

04

Write-off execution

Disposing of the obsolete stock the platform finds has its own accounting timing. Agree it with finance up front so identified savings become realized ones.

Note what’s not on the list for modern platforms: hardware and database licenses.

How Do We Justify the Cost to Finance?

Run the CFO math on three lines your finance team already tracks:

The CFO math: three lines finance already tracks

Line 1

Carrying cost avoided

MRO holdings × 15-25% annual carrying cost × the 15-30% reduction the program targets.

$450K-$1.5Mper year in avoided carry, on $20M inventory

Line 2

Working capital released

The one-time balance-sheet release of the excess itself.

$3M-$6Mone-time, on that same $20M holding

Line 3

Downtime avoided

Parts-driven downtime hours × cost per hour, from fixing the under-protected criticals the same analysis finds.

Your hours × your ratefrom the criticals the analysis finds

Against the platform’s total first-year cost, line 1 alone typically clears payback inside 12 months. Lines 2 and 3 are why these programs get CFO sponsorship rather than grudging approval.

Our ROI and business case guide includes the full model structure to present internally.

Want to see how this applies to your network?

Share your plant count, SKU volume, and ERP landscape and an MRO specialist will walk you through scope, the hidden costs on your side and the payback math on your figures.

✓ Plant count✓ SKU volume✓ ERP landscape
Talk to an MRO specialist →

Is a Pilot Worth Paying For, or Should We Demand It Free?

That’s the wrong question. The right one is what the pilot proves and what it converts into.

A well-structured pilot

01

Runs on a real extract

From your worst plant.

02

Returns evidence within 2–6 weeks

Evidenced duplicates, excess value, and under-protected criticals.

03

Is spot-checkable

By your own planners, on a random SKU sample.

04

Credits its cost against deployment

If you proceed.

Whether that’s free, paid, or credited matters far less than whether success criteria were agreed in writing before data changed hands.

A free pilot with vague criteria costs more than a paid one with sharp criteria: you pay in quarters, not dollars.

What’s Included With MRO360?

Straightforwardly: we’ll put a total first-year number in writing during evaluation.

What's included

MRO360, straightforwardly

  • A platform fee plus per-plant scaling
  • Standard SAP/Oracle/Maximo integration in scope
  • Pilot costs credited against deployment
  • A total first-year number (license, implementation, everything) in writing during evaluation

Where we're honest about fit

Below ~$3M MRO value, fix the process first

  • Very small single-site holdings (under ~$3M MRO value) often can't justify any enterprise platform's cost
  • Below that line, the carrying-cost math favors process fixes over software

What Does Doing Nothing Cost?

It’s the comparison every budget discussion should include. A $20M MRO inventory with typical 25% excess, standing still for one more year, means $750K-$1.25M in carrying cost on stock you don’t need, continued expedites and emergency freight on the criticals that aren’t protected, and an obsolescence pile quietly growing toward a write-off cliff.

The platform decision sits next to a seven-figure status quo. That asymmetry, not vendor features, is what gets these programs funded.

Run the payback math on your own figures

Tell us your plant count, ERP, and rough inventory value, and an MRO specialist will walk through scope and the first-year payback math on your figures.

Book a demo →

Frequently Asked Questions

How is MRO inventory optimization software priced?
Enterprise MRO inventory optimization platforms are priced by plants, SKU volume or inventory value under management. Implementation ranges from bundled (modern cloud platforms) to services-led engagements (legacy suites). Ask every vendor for total first-year cost: license, implementation, integration and services, not the license line alone.
What pricing models do MRO optimization vendors use?
Three dominate: per plant or site, per SKU volume (banded by active material count), and per inventory value under management. Most enterprise quotes blend a platform fee with one of these scaling axes. To compare vendors, normalize every quote to cost per plant per year and add first-year services.
What hidden costs should we budget for beyond the license?
Four costs sit on your side of the table: IT time for extracts or integration, SME time (a materials or storeroom lead for 2-4 hours per week through the first validation quarter), change management for planner training and policy governance, and write-off execution for the obsolete stock the platform finds, which should be agreed with finance up front.
How do you justify MRO optimization software cost to finance?
Run three lines finance already tracks: carrying cost avoided, working capital released and downtime avoided. On a $20M MRO inventory, a 15-30% reduction at a 15-25% carrying cost avoids $450K-$1.5M per year in carry and releases $3M-$6M of working capital. Against the platform's total first-year cost, the first line alone typically clears payback inside 12 months.
Should an MRO optimization pilot be free or paid?
What matters is what the pilot proves and what it converts into. A well-structured pilot runs on a real extract from your worst plant, returns evidenced duplicates, excess value and under-protected criticals within 2–6 weeks, can be spot-checked by your own planners, and credits its cost against deployment. Success criteria agreed in writing before data changes hands matter far more than whether it is free, paid or credited.
When is MRO inventory optimization software not worth the cost?
Very small single-site holdings, under roughly $3M in MRO value, often can't justify any enterprise platform's cost. Below that line the carrying-cost math favors process fixes over software.

Related reading: MRO Inventory Optimization ROI: The Business Case · MRO Optimization Software Buyer’s Guide · MRO Optimization Alternatives

Book A Demo

MRO Master Data Management for a leading $12Bn Oil and Gas company

Oil and Gas organizations face huge unwanted costs in the form of losses, penalties and compensation due to industrial accidents, taking a sizable chunk of their revenues. One of the important reasons for failures and accidents is the breakdown of key industrial infrastructure arising from ineffective management of the material base and inefficiencies in the MRO supply chain that are highly critical for the production and maintenance cycles.

More and more organizations are now looking to establish Master Data Management (MDM) implementations in order to manage their assets through informed decision-making based on reliable data and ensure optimal industrial safety across the enterprise.

About the company:

This US based company is a global leader in providing essential mechanical components for both land and offshore drilling rigs, complete drilling and well servicing rigs, as well as a comprehensive range of tubular inspection, internal coatings, drill string equipment, lifting and handling gear, and downhole drilling tools. It also offers supply chain services through distribution centers strategically located near major drilling and production sites worldwide. With over 800 manufacturing, sales, and service centers globally and annual revenues exceeding $12 billion, the company delivers customer-focused solutions tailored to meet the energy industry’s quality, productivity, and environmental needs.

Material Master Data Challenges

The company faced significant challenges with their master data.
• Lack of consistency and standards for the master data
• Incorrect, incomplete, unclassified and outdated attribute fields of master
data High volumes of data in multiple languages
• Multiple ERP and other legacy instances across the company
• Poorly structured material descriptions
• Lack of data governance and collaboration across cross-functional divisions and locations

Solution & Results Achieved

Solution: Material Master Data Harmonization & Ongoing Maintenance

The company implemented Verdantis Material Harmonize to cleanse and enrich its historical material master data. Using AI-powered tools and the Verdantis Content Repository, the solution classified, standardized, and eliminated duplicate materials.

Once the data was harmonized, Verdantis Material Integrity was deployed for ongoing data governance. It ensured continuous data accuracy through real-time validation, AI-driven classification, and duplication prevention, maintaining high data quality across enterprise systems.

Key Actions Taken:

  • Classified 150,000 materials into 1,210 UNSPSC and 500+ HTS codes
  • Parsed and normalized unstructured material attributes
  • Eliminated duplicates and enriched material descriptions
  • Established real-time data governance and approval workflows
  • Created a centralized repository for cross-functional data access

Results Achieved:

  • Improved Data Accuracy – Eliminated duplicate and inconsistent material records
  • Enhanced Classification – Standardized materials with UNSPSC & HTS codes
    Better Inventory Management – Optimized stock visibility and usage
  • Faster Procurement & Compliance – Enabled seamless material search & regulatory adherence
  • Sustainable Data Governance – Ensured ongoing accuracy with AI-driven maintenance
  • Informed Decision-Making – Centralized data repository for improved operational efficiency

By integrating Material Harmonize & Material Integrity, the company achieved a scalable, AI-powered Master Data Management framework, ensuring long-term data consistency, efficiency, and compliance.

Your data is secure and used solely for intended purposes. We prioritize your privacy and protect your information.