

Key Takeaways
- Asset criticality establishes the relative importance of every physical asset by evaluating the consequences of its failure across safety, environment, operations, and finance- giving maintenance and reliability teams a data-driven foundation for prioritization.
- A structured Asset Criticality Assessment (ACA) involves five stages – asset inventory, criteria definition, multi-factor scoring, tier classification, and continuous review -producing a ranked register that drives smarter maintenance strategies, capital investment decisions, and risk management across the entire asset lifecycle.
- Successful criticality programmes require clean asset master data, cross-functional collaboration, integration with CMMS and ERP systems, and regular governance reviews and the Verdantis approach delivers all of this end-to-end: from AI-powered data harmonization and criticality scoring to seamless SAP, Maximo, and EAM integration.
Read the full article below to learn more.
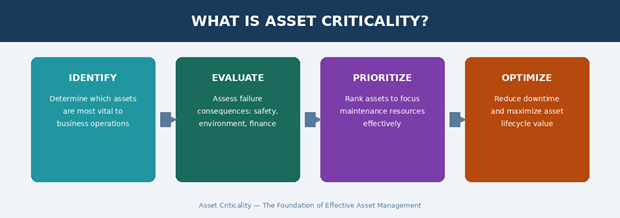
Asset criticality is a systematic process for ranking physical assets, equipment, machinery, infrastructure, and systems, based on the consequence of their failure on safety, production, environment, regulatory compliance, and cost.
Not all assets carry equal weight. A failed sensor on a utility air compressor has very different business consequences than a failed cooling pump on a process reactor or a failed valve on a gas transmission pipeline.
Asset criticality analysis forces every organization to answer one fundamental question:
"What happens if this asset fails, and how badly does that failure impact the business?"
In asset-intensive industries, Maintenance, Repair, and Operations (MRO) functions are constantly balancing cost, risk, and reliability. One of the most persistent inefficiencies in MRO data management programs stems from a simple issue:
Not all assets are managed according to their true criticality.
This leads to over-maintenance of non-critical equipment, under-maintenance of high-risk assets, and inefficient spare parts strategies. This is where Asset Criticality Assessment (ACA) becomes essential.
By systematically evaluating the importance of each asset, organizations can prioritize resources, improve maintenance strategies, and drive measurable business outcomes.






Industries That Depend on Asset Criticality
Asset criticality frameworks are deployed across every capital-intensive industry where equipment failure has significant operational, safety, or financial consequences.
Key Personas Involved
Asset criticality is a cross-functional discipline. It demands operational knowledge, financial acumen, safety expertise, and data literacy – no single person has the full picture.
Key Personas Involved
Asset criticality is a cross-functional discipline. It demands operational knowledge, financial acumen, safety expertise, and data literacy – no single person has the full picture.
Effective criticality assessments require a structured multi-disciplinary workshop. Bias toward safety or production in isolation leads to systematically incorrect rankings.
No single persona sees the full picture,all six must be at the table, with a neutral facilitator managing conflict resolution and calibration.
What Is Asset Criticality Assessment?
Asset Criticality Assessment (ACA) is a structured methodology for ranking assets by the consequence of their failure.
Rather than treating all equipment the same, ACA helps organizations identify which assets carry the highest impact across key dimensions such as:
- Safety
- Environmental impact
- Production loss
- Maintenance cost
- Regulatory compliance
The outcome is typically a tiered classification, for example Tier 1, Tier 2, Tier 3, or Critical, Semi-Critical, Non-Critical, that enables focused decision-making.
The output of an asset criticality assessment is a ranked register, typically tiered as Critical (A / Tier 1), Semi-Critical (B / Tier 2), and Non-Critical (C / Tier 3), which then drives decisions across maintenance strategy, capital allocation, spare parts stocking, inspection frequency, and risk mitigation investment.
Asset criticality is not a one-time exercise. It is a living program that must be re-evaluated when plant configurations change, when new regulatory requirements emerge, or when operational risk profiles shift.
ISO 55000, the international standard for asset management, explicitly recommends criticality assessment as a foundation for lifecycle decision-making.
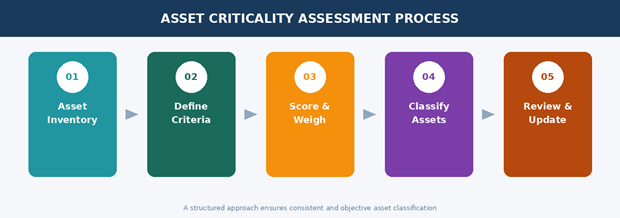
Ensure all maintainable assets are captured in your system with accurate, complete data. Poor data quality, duplicates, missing details, produces unreliable criticality results.
Set evaluation factors such as safety, environmental impact, production loss, cost, and redundancy. Assign weightings based on business priorities.
Evaluate assets on a consistent scale (for example 1-5). Combine scores with weightings to calculate an overall criticality score.
Group assets into categories such as Critical, High, Medium, or Low to guide maintenance, spares, and investment decisions.
Regularly update criticality scores based on changes in operations, asset condition, or business priorities.
The Assessment Process & Flow
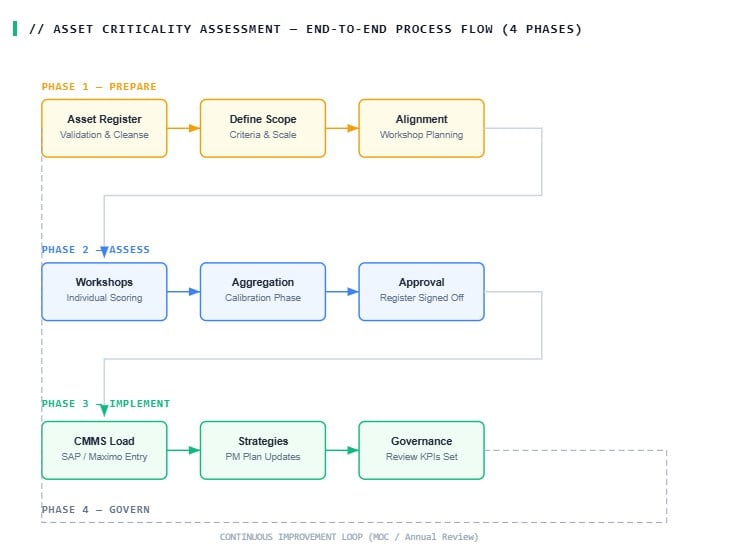
A well-structured asset criticality assessment follows a defined, repeatable process. Here is the end-to-end flow from initiation through CMMS integration and ongoing governance.
Criticality-Driven Maintenance Strategy Matrix
| Criticality Tier | Score Range | Maintenance Approach | Inspection Frequency | Spare Parts Policy |
|---|---|---|---|---|
| Tier A - Critical | 4.0 - 5.0 | Predictive / condition-based plus RCM analysis. Zero tolerance for unplanned failure. | Continuous / real-time monitoring | On-site capital spare, consignment stock |
| Tier B - Semi-Critical | 2.5 - 3.9 | Preventive maintenance with defined intervals. Enhanced inspection scope. | Monthly / quarterly | Warehouse stock with reorder point |
| Tier C - Non-Critical | 0 - 2.4 | Run-to-failure or basic time-based PM. Minimal inspection overhead. | Annual / on condition | Order on demand / JIT procurement |
What Is Asset Criticality Ranking?
Asset criticality ranking is the process of assigning a criticality score to each asset and using it to build a prioritized list.
While an assessment defines the criteria, ranking is where those criteria are applied across the full asset base to determine which ones matter most. Without a clear ranking, decisions such as maintenance planning, spare stocking, and backlog prioritization become inconsistent and reactive.
Calculating Asset Criticality
Asset criticality is calculated using a risk-based scoring model that combines how likely an asset is to fail with the impact of that failure. The most commonly used formula is:
Step 1: Assign Probability of Failure (PoF)
PoF is typically scored on a scale of 1-5 based on:
- Failure history (MTBF)
- Asset age / condition
- Operating environment
- Maintenance effectiveness
Example scale: 1 = rare failure · 3 = occasional failure · 5 = frequent failure
Step 2: Calculate Consequence of Failure (CoF)
Rather than a single value, CoF is usually derived from multiple impact areas:
Where: S = Safety impact, P = Production loss, C = Cost impact, E = Environmental impact. Each parameter is scored from 1-5.
Example 1: Refinery Pump
| Factor | Score |
|---|---|
| Safety (S) | 4 |
| Production (P) | 5 |
| Cost (C) | 4 |
| Environment (E) | 3 |
CoF = (4 + 5 + 4 + 3) / 4 = 4.0
If PoF = 3: Criticality = 3 × 4 = 12, Medium-High
MRO Insight: Preventive maintenance plus condition monitoring is required.
FMEA-Based Calculation (Advanced)
For deeper analysis, particularly in reliability engineering, the Risk Priority Number (RPN) is used.
Example: Gearbox in Conveyor System
Severity = 9 (production halt) · Occurrence = 6 (moderate failures) · Detection = 7 (hard to detect early)
RPN = 9 × 6 × 7 = 378, Very High
Financial Criticality Model
Example: Boiler Feed Pump
Failures per year = 3 · Cost per failure = $50,000
Criticality = $150,000 annual risk
Final Interpretation (Typical Mapping)
| Score Range | Criticality | MRO Strategy |
|---|---|---|
| 1-5 | Low | Run-to-failure |
| 6-12 | Medium | Preventive maintenance |
| 13-20 | High | Predictive maintenance |
| >20 | Extreme | Redundancy plus continuous monitoring |
In practice, organizations combine these models to ensure asset criticality reflects not just failure risk, but also operational and financial impact, enabling precise MRO planning and resource prioritization.
Methodology & Scoring Criteria
The semi-quantitative weighted scoring method is the industry standard, used in frameworks such as API 580, ISO 31000, and the SMRP Best Practices Guide. Here is how it works in practice.
Core Consequence Categories
| # | Category | Definition | Typical Weight | Scale |
|---|---|---|---|---|
| 1 | Safety | Risk of injury, fatality, or harm to personnel or the public on failure | 25-35% | 1-5 |
| 2 | Environmental Impact | Risk of release, contamination, regulatory breach, or lasting environmental damage | 15-25% | 1-5 |
| 3 | Production / Throughput | Revenue loss, throughput reduction, or critical service interruption with no bypass | 20-30% | 1-5 |
| 4 | Maintenance Cost | Direct cost to repair or replace, labor, parts, and lost opportunity cost | 10-15% | 1-5 |
| 5 | Regulatory / Compliance | Risk of regulatory fine, legal liability, or permit violation on failure | 10-15% | 1-5 |
| 6 | Reputation / Customer | Public confidence risk, customer SLA breach, or brand damage exposure | 5-10% | 1-5 |
The Scoring Formula
Standard weighted criticality score formula
Criticality Score = Σ (Category Scorei × Weighti)
Example: Gas Injection Compressor, Offshore Platform
Safety [5 × 0.35] + Environmental [4 × 0.20] + Production [5 × 0.25] + Cost [3 × 0.10] + Regulatory [4 × 0.10]
= 1.75 + 0.80 + 1.25 + 0.30 + 0.40 = 4.50 / 5.00, CRITICAL TIER A
The 5×5 Risk Matrix
When probability of failure is layered onto criticality, assets are plotted on a risk matrix to guide inspection frequency and maintenance strategy selection.
| Negligible | Marginal | Moderate | Critical | Catastrophic | |
|---|---|---|---|---|---|
| Rare | LOW | LOW | LOW | MED | MED |
| Unlikely | LOW | LOW | MED | MED | HIGH |
| Possible | LOW | MED | MED | HIGH | HIGH |
| Likely | MED | MED | HIGH | HIGH | EXTREME |
| Certain | MED | HIGH | HIGH | EXTREME | EXTREME |
Asset Criticality Analysis
Asset Criticality Analysis (ACA) goes beyond scoring and ranking to deliver deeper operational intelligence. It systematically examines criticality data, both individually and across asset populations, to identify patterns, failure hotspots, maintenance optimization opportunities, and risk concentrations.
Effective analysis turns raw criticality scores into strategic insight that informs asset management plans, capital budgets, and risk registers, the analytical engine that connects criticality assessment outputs to business decisions.
Advanced Considerations in Asset Criticality
- Hidden Failures: Some assets, such as safety valves or standby systems, can fail without visible signs but have severe consequences. These are typically treated as high-critical and require regular testing.
- Bottleneck Analysis: Even a low-critical asset can become critical if it acts as a constraint in the production process.
- Dynamic Criticality: Asset criticality is not fixed, it changes based on operating conditions, asset health, production priorities, and the availability of redundancy.
- Digital Integration: Integrating ACA with CMMS, EAM, and predictive tools enables real-time updates, automated prioritization, and more data-driven maintenance decisions.
See Your Own Asset Register Scored Live
Bring a sample of your CMMS or EAM asset register. We'll show which assets are genuinely critical, which flagged assets aren't, and where your data quality would distort a criticality score today.
Types of Asset Criticality
There is no single universal criticality framework. Different approaches suit different organizational maturity levels, industries, and regulatory environments.
| Type | Description | Best For | Complexity |
|---|---|---|---|
| Qualitative / Tiered BASIC |
Assets assigned A/B/C or 1/2/3 tiers based on workshop judgment. Simple criteria, no weighted numerical scoring. Fast to execute. | Organizations beginning their criticality journey, small asset bases (under 5,000 assets) | Low |
| Semi-Quantitative (Weighted Score) STANDARD |
Multiple consequence categories scored numerically and weighted per organizational priorities. Produces a defensible numeric score and tiered classification. Aligned to API 580 and SMRP frameworks. | Most oil and gas, utilities, mining, and chemical organizations. Integrates well with SAP PM and IBM Maximo. | Medium |
| Risk-Based (Probability × Consequence) ADVANCED |
Combines likelihood of failure, using degradation models, inspection data, age/condition, with criticality consequences to generate a Risk Priority Number (RPN) and plot assets on a risk matrix. | Oil and gas, chemicals, power generation, assets with rich CMMS reliability history | High |
| Reliability-Centered (RCM-Driven) EXPERT |
Criticality embedded in a full RCM analysis, Failure Mode and Effects Analysis (FMEA) mapped to functional failures. Every maintenance task is justified from the criticality logic. Highest fidelity, most resource-intensive. | High-value, low-population assets in power, rail, and process industries. Typically applied to the top 5% of critical assets. | Very High |
| Condition-Modified Criticality STANDARD+ |
Static asset criticality ranking adjusted dynamically based on current asset condition score from predictive maintenance outputs, inspection grades, or sensor data. A Tier B asset in poor condition may be temporarily elevated to Tier A urgency. | Organizations with mature CBM programs and IoT/sensor integration | Medium-High |
Verdantis Approach to Asset Criticality
Verdantis brings an AI-native approach to asset criticality, recognizing that the foundational barrier to accurate criticality scoring is not methodology, but data quality and taxonomy governance, alongside asset master data management.
Most asset criticality programs fail silently because they are built on top of asset registers that are incomplete, inconsistent, or unmaintained.
Verdantis begins every criticality engagement with an asset data health assessment, before any scoring begins. The principle: you cannot accurately score what you cannot accurately describe.
The Verdantis Difference
While many approaches focus on the scoring methodology, Verdantis focuses on the data layer underneath it.
A 4.8-scored pump that is actually a duplicate of a 1.2-scored utility pump leads to a serious misallocation of maintenance resources. Data integrity is not a prerequisite, it is the criticality program itself.
Verdantis Asset Criticality: 8-Step Methodology
The process begins with extracting the asset register from the client's CMMS/EAM systems (SAP PM, Maximo, Oracle, Infor). Each asset is evaluated for readiness by assessing the availability of key attributes such as equipment type, location, and operational context.
Data gaps such as missing hierarchies, duplicate records, or incomplete attributes are identified early, to ensure only reliable, scoreable assets are included in the assessment.
Assets are standardized using industry-aligned frameworks (ISO 14224, ISO 55000), ensuring consistent equipment classification and hierarchy structures.
Missing operational context is enriched using available engineering references such as P&IDs, OEM data, and maintenance history, enabling more accurate and consistent criticality scoring.
A tailored scoring framework is configured to the client's operational environment. This includes:
- Defining consequence categories (safety, production, cost, environment)
- Assigning weightages
- Establishing scoring scales and thresholds
This ensures the model reflects real operational risk and business priorities.
Using the configured framework and enriched asset data, an initial criticality score is generated across the asset base.
The scoring draws on equipment class, process context, and failure impact mapping to produce a consistent, scalable baseline criticality profile.
Criticality scores are reviewed and calibrated with a focus on high-impact and edge-case assets.
This step ensures scoring consistency, removes anomalies, and aligns results with actual plant behavior and operational dependencies.
Finalized criticality scores and tiers are integrated into the client's CMMS/EAM system at the equipment level.
This makes criticality an operational parameter, directly usable for maintenance planning, prioritization, and reporting.
Criticality tiers are mapped to maintenance strategies:
- High critical → Predictive / condition-based maintenance
- Medium → Preventive maintenance
- Low → Run-to-failure
This step ensures the assessment translates into practical MRO actions and optimized maintenance effort.
A structured governance approach keeps criticality relevant over time. This includes:
- Periodic updates based on asset condition and performance
- Incorporation of new assets and operational changes
- Defined ownership for maintaining accuracy
This ensures asset criticality remains dynamic and aligned with real-time operational needs.
What MRO360's Asset Criticality Module Delivers
The 8-step methodology above is how Verdantis stands the program up. This is what the software itself does once it's live, the difference between a criticality exercise and a criticality system.
Consequence categories, weightings, and score thresholds are configured to your operational environment, not hard-coded to a generic template.
Criticality scores and tiers write directly into SAP PM, Maximo, Oracle, or Infor at the equipment level, so it's an operational field, not a spreadsheet export.
New asset installs, MOC events, decommissioning, and condition-monitoring inputs automatically flag assets for re-evaluation instead of waiting for the next scheduled review.
Every asset record is scored for completeness and reliability before it enters the criticality model, so low-quality data doesn't quietly distort the register.
Criticality tiers map directly to maintenance strategy assignments, predictive, preventive, or run-to-failure, without a planner manually cross-referencing a matrix.
Scores cascade automatically from system and functional location down through asset, equipment, and spare part levels, keeping the full hierarchy consistent as any one level changes.
Red Flags When Choosing Asset Criticality Software
Signals that a "criticality tool" is a scoring calculator, not an operational asset management system.
If consequence categories and weightings can't be tailored to your operational and regulatory environment, the score won't reflect real risk.
If tiers live only in the vendor's own dashboard, planners never actually see them at the point of work order creation.
A register that doesn't flag itself after MOC events, decommissioning, or condition changes drifts from reality within a year.
Scoring on top of unvalidated, duplicate-riddled asset records produces confident-looking numbers that are quietly wrong.
If the tool can't cascade scores from system and functional location down to spare parts, every level has to be scored manually and separately.
A consulting engagement that produces a one-time spreadsheet isn't software, it's a report that starts decaying the day it's delivered.
Real deployment
Featured Case Study
Oil & Gas · Refining
Closing the SAP MRP-to-Criticality Gap in Refining
A refiner's SAP asset register carried criticality flags that hadn't been revalidated since initial commissioning, drifted years out of sync with actual operating context, condition, and consequence of failure. Reconciling the asset-level criticality model against current reality exposed which "critical" tags were stale and which genuinely high-risk equipment had never been flagged at all.
Read the full case study →Challenges & Common Problems
Despite its apparent simplicity, asset criticality programs routinely fail or stagnate, often for structural and organizational reasons, not technical ones.
Data Quality Problems
Criticality scoring is only as good as the underlying asset data. Missing equipment attributes, absent process function, missing operating context, and no failure mode history all lead to scoring on gut feel rather than evidence.
- Duplicate asset records distort scoring populations
- Missing functional location hierarchy blocks consequence propagation
- No linkage between the asset register and process P&IDs
- CMMS data never validated after ERP go-live or migration
- Inconsistent noun/modifier taxonomy makes class-level scoring impossible
Subjectivity & Scoring Bias
When criticality is assessed by a single engineer without a defined framework, it reflects personal experience and recency bias. Different engineers score identical assets differently. Recent near-misses inflate safety scores; familiarity with an asset can bias scores downward.
Organizational Silos
Safety, maintenance, operations, and supply chain rarely agree on what "critical" means. An HSE team might rate a tank critical due to environmental exposure, while operations rates it non-critical because it has full redundancy. Without a common scoring framework and cross-functional governance, these conflicts remain unresolved.
Point-in-Time Thinking
Many organizations conduct a criticality exercise once, embed it in the CMMS, and never revisit it. Plants evolve, new equipment is installed, production profiles change, and regulations tighten. A static criticality register becomes increasingly inaccurate.
- No formal trigger defined for re-assessment after MOC events
- Criticality register diverges from the CMMS asset master over time
- Decommissioned assets retain old criticality scores in the system
- No governance owner to enforce review cadence
Fix the Data Problem Before It Sinks Your Program
Most asset criticality programs fail on the data layer, not the methodology. We start every engagement with a free asset data health assessment so you know what you're working with before scoring begins.
The Business Case of Asset Criticality Management
Unplanned downtime costs industrial companies an estimated $50 billion per year globally. Asset criticality programs are among the highest-ROI investments an organization can make to reduce that figure.
Without a criticality framework, maintenance teams treat all assets with similar urgency, wasting resources on low-consequence equipment while genuinely critical assets go under-maintained.
The Pareto effect holds consistently across industries: roughly 5-10% of assets account for 70-80% of total downtime and safety risk.
The Business Case of Asset Criticality Management
Unplanned downtime costs industrial companies an estimated $50 billion per year globally. Asset criticality programs are among the highest-ROI investments an organization can make to reduce that figure.
Where Cost and Downtime Concentrate
SOURCE: SMRP BEST PRACTICES
Without a criticality framework, maintenance teams treat all assets with similar urgency, wasting resources on low-consequence equipment while genuinely critical assets go under-maintained. The Pareto effect above holds consistently across industries.
Asset vs. Equipment vs. Spare Parts vs. Functional Location Criticality
These terms are often used interchangeably, incorrectly. Each represents a distinct level of the asset hierarchy, scored with different criteria, owned by different teams, and used to drive different decisions.
Asset Criticality
The broadest classification. Scores a physical asset, an individual piece of equipment or system, on its consequence of failure across safety, environment, production, cost, and regulatory dimensions. The parent classification that all others flow from.
Equipment Criticality
A sub-classification within asset criticality focused specifically on the physical equipment object, its condition, age, maintainability, and design robustness. Often used in RCM programs to differentiate between identical asset types based on operating context and failure history.
Spare Parts Criticality
Classification of MRO spare parts and materials based on their consequence of non-availability at the time of asset failure. Inherits from parent asset criticality but is further scored on lead time, replaceability, and failure consequence impact window. See our dedicated guide on spare parts criticality management.
Functional Location Criticality
Classifies a position in the plant hierarchy, a functional location or operating unit, rather than an individual piece of equipment. Used in large, complex plants to prioritize which process units or areas receive the most maintenance resource and budget attention.
System / Process Criticality
Evaluates the criticality of an entire system, for example a cooling water system, fire and gas detection, or lube oil system, rather than individual components. Used in safety-critical and process industries where system-level failure analysis is mandated by regulations such as PSSR, PED, or SIL requirements.
Criticality Hierarchy Cascade: From System to Spare Part
| Parameter | Type 01: Asset | Type 02: Equipment | Type 03: Spare Parts | Type 04: Functional Loc. | Type 05: System / Process |
|---|---|---|---|---|---|
| Hierarchy Level | Equipment / Tag Level | Equipment Tag / Serial Number Level | Material / Stock Code Level (BOM) | Plant / Unit / System / Subsystem Level | System / Process Function Level |
| Scored By | Multi-disciplinary workshop (HSE, Ops, Maintenance) | Maintenance / Reliability Engineering | Materials Management + Maintenance | Asset Management + Production Planning | Process / Safety Engineering + Operations |
| Output | Tier A/B/C classification + numeric score | Condition and failure-adjusted criticality | Stocking policy (On-site / Warehouse / On-demand) | Critical unit ranking | System criticality for HAZOP / SIL |
| Drives | Maintenance strategy, inspection plans, PM frequency | Inspection scope, overhaul planning | Inventory levels, safety stock | Shutdown planning, resource allocation | Safety case, SIL determination |
| Stored In | CMMS / EAM equipment master (SAP PM, Maximo) | CMMS work orders & inspection records | ERP / WMS (SAP MM, Oracle INV) | CMMS Functional Location (SAP FL) | Safety systems / P&ID register |
| Review Trigger | MOC events, new assets, annual review cycle | Post-failure, condition updates | Lead time changes, stockouts | Process or production changes | HAZOP revalidation, audits |
| Example | Centrifugal pump P-1001 = Tier A Critical (score 4.6) | P-1001 aged vs. P-1002 new | Impeller → Capital spare | Feed Compression Unit critical | ESD System = SIL 2 |
Market Context
| Dimension | Asset | Equipment | Spare Parts | Functional Loc. | System |
|---|---|---|---|---|---|
| Primary Question | What's the impact if this asset fails? | How likely is this specific unit to fail, given its condition? | What happens if this part is unavailable at failure? | Which plant area is most critical to production continuity? | What is the safety / process consequence of this system failing? |
| Scoring Unit | Equipment tag (e.g. P-1001) | Equipment serial / instance | Material / stock code (e.g. 10042211) | SAP Functional Location / Operating Unit | Process system (e.g. cooling water, ESD) |
| Key Scoring Criteria | Safety, environment, production, cost, regulatory | Condition grade, MTBF, repair complexity, age | Lead time, parent criticality, replaceability, frequency of use | Process throughput, redundancy, downstream impact | SIL rating, hazard severity, safeguard availability |
| Primary Output | A/B/C tier + numeric score | Modified criticality (elevated or reduced) | Stocking policy: Capital / Warehouse / On-demand | Unit priority ranking (budget, shutdown scope) | Safety integrity level, maintenance category |
| Owner | Asset / Maintenance Manager | Reliability Engineer | Materials / Inventory Manager | Asset Manager / Plant Director | Process Safety / SIL Engineer |
| Review Frequency | Annual + MOC triggered | Post-failure + inspection cycle | Annual + lead time / decommission triggered | 3-5 years + major process change | HAZOP revalidation cycle (3-10 years) |
| Applicable Standard | ISO 55000, API 580, SMRP | ISO 14224, IEC 60300 | SMRP BP 2.1, GFMAM | ISO 55000, PAS 55 | IEC 61511, IEC 61508, PSSR |
Asset Criticality vs. Asset Risk
These two terms are often conflated. The distinction is critical to get right:
Asset Criticality is the potential consequence of failure, how bad the impact is when the asset fails, irrespective of how likely that failure is. It is static and scenario-based.
Asset Risk = Criticality × Probability. It layers in likelihood of failure, degradation rate, and reliability data. Risk informs maintenance tactics; criticality informs maintenance strategy.
Criticality at Spare Part Level
Asset criticality is only half the equation. Spare parts criticality determines which components must be stocked on-site, which can be ordered on-demand, and which represent strategic insurance against catastrophic production loss.
In capital-intensive industries, inventory carrying costs for spare parts average 20-30% of stock value per year.
Organizations routinely carry tens of millions of dollars in stagnant, over-stocked spare parts for non-critical assets, while simultaneously experiencing stockouts on the critical spares that stop production. Spare parts criticality analysis directly addresses this imbalance.
Verdantis Approach to Spare Parts Criticality
Spare parts criticality at Verdantis is an extension of asset criticality, inheriting the parent asset's score and adding the factors specific to stocking a physical part rather than maintaining a piece of equipment.
Each spare part is scored using a five-factor model:
- Parent Asset Criticality
- Supplier Lead Time Score
- Part Replaceability / Availability on Open Market
- Historical Failure / Consumption Frequency
- Consequence of Non-Availability
Scores generate a Spare Parts Criticality Index (SPCI) that maps directly to a stocking policy: on-site capital spare, warehouse stock with reorder point, or order-on-demand.
This score is only as reliable as the master data behind it, which is why MRO data cleansing and asset-to-part BOM linkage are treated as prerequisites, not afterthoughts, and why insurance-spare decisions, inventory rationalization, and stocking-policy automation are handled as part of the same governed program rather than as one-off exercises.
Explore the full methodology, including the ABC-VED matrix, insurance spare logic, governance triggers, and common implementation mistakes, in our dedicated guide.
Key Principle
Spare parts criticality is not a one-time rationalization exercise. It must be a continuously maintained program, triggered by new asset installations, decommissioning events, supplier lead time changes, and annual review cycles, all governed through the same MDM platform as the asset criticality register.
Conclusion
Asset criticality is foundational infrastructure for modern maintenance and asset management. Organizations that build it and maintain it properly make systematically better decisions about where to deploy maintenance resources, how to stock spare parts, and where to invest capital.
The journey from informal asset knowledge to a formally governed, CMMS-integrated criticality program typically takes 3-9 months, depending on asset base size and data quality maturity. The return is consistently positive across every industrial sector: reduced unplanned downtime, lower total maintenance costs, optimized inventory investment, stronger regulatory compliance, and a more defensible capital allocation process.
Asset Criticality Assessment is a cornerstone of effective MRO strategy. Implemented correctly, it transforms maintenance from a reactive function into a risk-based, value-driven discipline.
By focusing engineering effort, maintenance resources, and inventory investment where they matter most, organizations can achieve:
- Reduced unplanned downtime
- Optimized maintenance cost
- Improved asset reliability
- Better risk control
Verdantis partners with asset-intensive organizations to deliver this foundation, combining MRO data management expertise, AI-native automation, and deep integration capability to make asset criticality a living, operational program rather than a static document.