MRO inventory management is the discipline of planning, controlling, and optimizing stock across all maintenance, repair, and operations categories, like spare parts, consumables, tools, PPE, and indirect materials, to ensure the right item is available for every maintenance event, at every site, without tying up working capital in excess or redundant stock.
MRO typically represents 5–8% of total procurement spend in a heavy industrial organization, yet accounts for 40–60% of all procurement transactions and is the most systematically undermanaged category in most industrial operations.
What MRO Inventory Management Actually Covers
The most persistent error in MRO management, and in MRO software selection, is treating “MRO inventory” as shorthand for spare parts alone. It is not.
MRO inventory spans five structurally distinct categories. Each has different demand patterns, different storage requirements, different supplier dynamics, and different management logic.
Applying the same inventory rules to a pump seal as to a box of nitrile gloves creates failure in both directions: over-stocked on consumables, under-stocked on critical spares.
| Category | Demand Pattern | Typical Management Approach | Key Risk if Mismanaged | Risk Level |
|---|---|---|---|---|
| Spare Parts | Intermittent, failure-driven or schedule-driven | Criticality-based stocking, ROP / safety stock, rotable loops | Unplanned equipment downtime; production loss | Critical |
| Consumables | Continuous, predictable, volume-driven | Min / max with VMI or vending; supplier-managed replenishment | Production inefficiency; excessive transaction cost on small orders | High |
| Tools & Equipment | Infrequent, project or maintenance-driven | Tool crib management, calibration tracking, check-out / return workflows | Lost tools, non-compliance, safety incidents from uncalibrated instruments | High |
| Safety / PPE | Continuous with regulatory minimums | Vending machines, compliance-driven minimums, usage tracking by worker | Regulatory violation; reportable safety incidents | Critical |
| Indirect Materials | Irregular, budget-driven | Catalogue procurement, spend analytics, supplier consolidation | Rogue spend, cost overrun, supplier proliferation | Medium |
The MRO Paradox
MRO punches far above its weight in operational complexity. The numbers below explain why it consistently overwhelms organizations that try to manage it with general-purpose procurement and inventory tools.
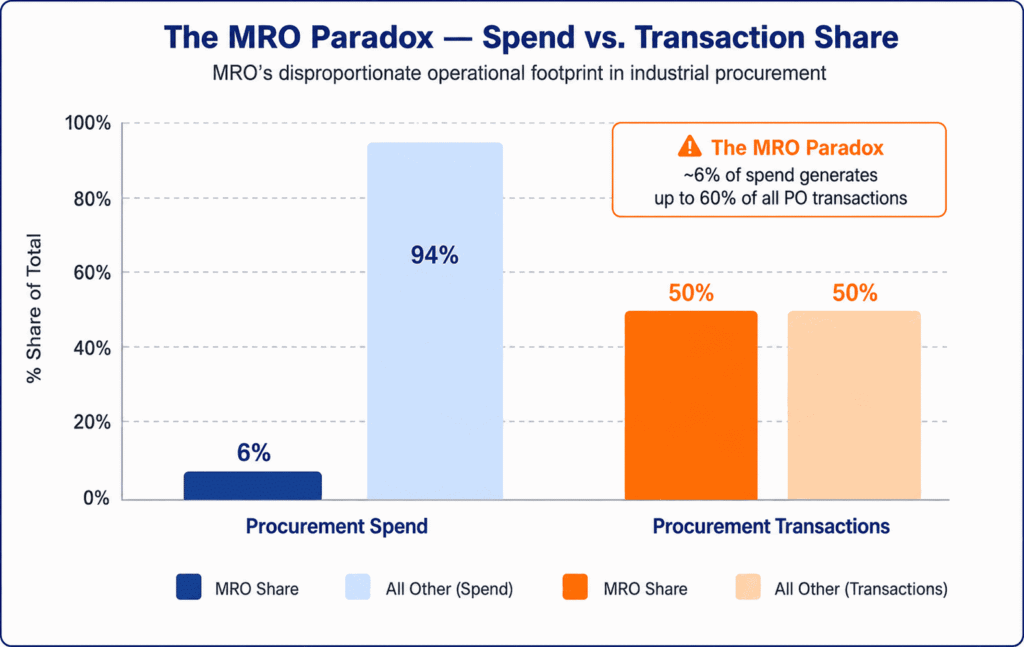
The transaction cost paradox is the clearest illustration: the cost of raising a purchase requisition, routing approval, issuing a PO, receiving goods, and matching an invoice is largely fixed regardless of order value.
MRO’s combination of low unit values and high transaction volumes makes it the category where administrative cost most frequently exceeds material cost. This is a structural problem, not a process inefficiency.
Solving it requires changing how MRO is managed at the system level, not improving manual workflows.
Organizations frequently do not know their true MRO inventory value. Because MRO spans maintenance, operations, and facility management, it is almost never consolidated into a single enterprise-wide view. Total MRO inventory value across sites is therefore a figure that most organizations can estimate only within a wide margin.
The cost of processing a purchase order, raising the PR, approving it, issuing the PO, receiving, invoice matching, is relatively fixed regardless of order value.
A $12 O-ring processed through the full P2P cycle can cost more in administrative overhead than the part itself.
In manual procurement environments, the fully loaded cost per purchase order runs $50-$150.
With e-procurement and catalogue adoption, this drops to $8-$25. Multiplied across tens of thousands of MRO transactions annually, the difference is significant.
MRO parts are ordered from hundreds of suppliers in dozens of formats, with inconsistent descriptions.
The same physical part, a 6205 bearing, can exist in an organization’s system under 15 or more different descriptions: “6205 bearing,” “deep groove ball bearing 6205,” “SKF 6205,” “bearing 25x52x15mm.”
Each becomes a separate item, generating duplicate stock and separate purchase orders.
Most industrial organizations have 60–80% of their MRO part numbers accounting for less than 5% of MRO spend.
This tail is nearly impossible to manage manually, yet individual items within it can be individually critical to operations.
The long tail is where stockouts concentrate.
Because MRO is dispersed across maintenance, operations, procurement, and facility management, it is rarely consolidated into a single view.
Organizations frequently do not know their true MRO inventory value, or what share of it they actually need.
Visibility is the prerequisite for every downstream improvement.
Why MRO Inventory Demand Requires Different Logic Than Standard Inventory
Standard inventory software is designed for a world of continuous, relatively predictable consumption, manufacturing inputs, retail SKUs, distribution goods.
MRO demand is structurally different at every level, and the mismatch between standard logic and MRO reality is where most inventory failures originate.
Bi-Modal Demand Distribution
MRO inventory contains a small population of fast-moving consumables (high-frequency, predictable demand) and a large population of slow-moving or insurance spares (zero or near-zero demand for extended periods).
Standard software is optimized for the fast-moving segment and performs poorly on the slow-moving population, which is, by part count, the majority of MRO items.
Maintenance Driven Demand
A significant portion of spare parts demand is not random failure, it is planned maintenance driven by time intervals, meter readings, or condition triggers.
This demand is knowable in advance, but only if the inventory system has visibility into the maintenance schedule.
Without work order planning, forecasts are structurally incomplete.
Planned Shutdown Demand Spikes
Scheduled maintenance shutdowns, turnarounds, outages, planned overhauls, create massive, concentrated demand events requiring specific planning logic:
- bulk reservations,
- pre-kitting,
- temporary storage staging, and
- supplier commitments months in advance.
Standard inventory systems have no concept of this planning mode.
The Zero-Demand Problem
A part with zero consumption over 24 months is either genuinely unnecessary (a disposal candidate) or critically necessary but never consumed (an insurance spare that has been doing its job correctly).
Standard analytics cannot distinguish between these states, both look like dead stock. Software that automatically flags zero-consumption items for disposal without criticality and asset context will liquidate critical spares and create the downtime events it was supposed to prevent.
A part that appears slow-moving at each individual site may actually be fast-moving at the network level, enabling a pooled central stock strategy instead of duplicated local buffers.
This requires multi-site inventory visibility that most site-level systems cannot provide. Organizations implementing network-level pooling commonly reduce safety stock requirements by 15–20% without increasing stockout risk.
What Most Organizations Are Not Measuring - TCO for MRO
Most MRO cost conversations focus on unit purchase price. The practitioner-level insight is that purchase price is often the smallest component of total MRO cost, and optimizing it in isolation frequently increases the total.
The Total Cost of MRO Ownership (TCMO) framework accounts for all four domains that determine the real economics of any MRO item.
Acquisition Cost
- Unit purchase price Baseline
- P2P transaction processing $50–$150 / PO
- Emergency procurement premium 2×–4× planned
- Freight & logistics
Holding Cost
- Capital cost of inventory 10–15% / yr
- Storage, racking & handling
- Obsolescence & deterioration risk
- Insurance & shrinkage
Stockout Cost
- Equipment downtime cost per hour
- Maintenance overtime
- Emergency procurement execution
- Production loss revenue impact
Management Cost
- Storeroom labour (receiving, issuing)
- System & technology cost
- Supplier management overhead
- Audit & compliance cost
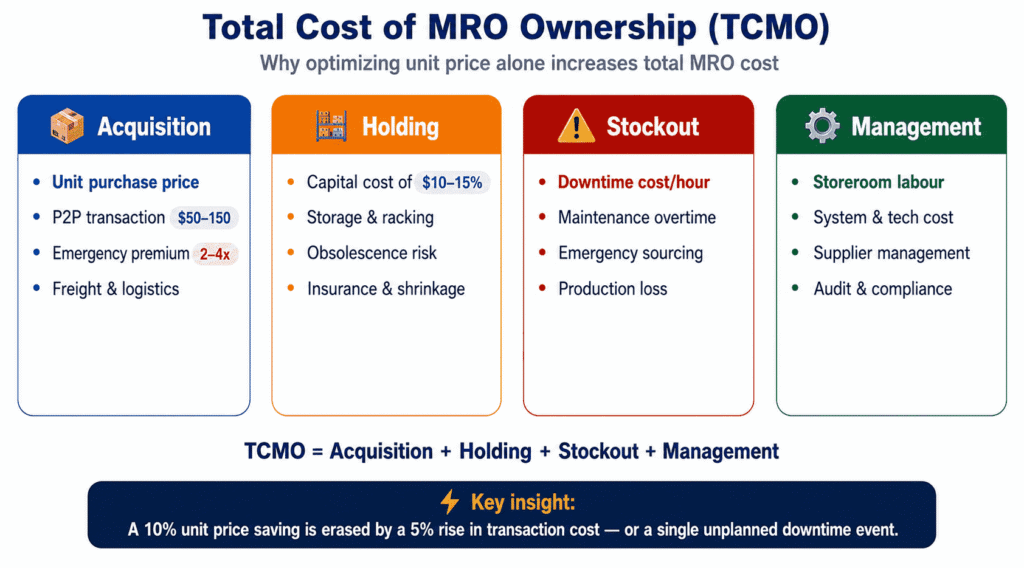
The Unit Price Trap
A 10% reduction in unit price can be entirely consumed by a 5% increase in transaction cost or by a single unplanned downtime event.
Organizations that optimize only on purchase price often increase total MRO cost by driving order frequency up, accepting longer lead times from the cheapest supplier, and introducing quality issues that result in premature part failures.
MRO Catalogue Management - The Prerequisite Most Operations Skip
MRO catalogue management is the discipline of maintaining a clean, standardized, deduplicated master list of all MRO items the organization buys.
Almost no MRO content covers this at a technical level, yet it is the single greatest determinant of MRO management effectiveness downstream.
Without it, every downstream process, stocking, replenishment, spend analysis, operates on a broken foundation. You cannot right-size stock you cannot identify. You cannot analyze spend you cannot aggregate.
The Duplication Problem
The same physical part can exist in an organization’s system under 10–15 different descriptions, part numbers, or supplier codes.
Each becomes a separate item in the catalogue, generating separate purchase orders and separate stock positions across locations.
Organizations that conduct full MRO catalogue cleanses typically find 15–30% of their part numbers are duplicates, meaning they carry inventory they already own, just under a different description.
Description Standardization & UNSPSC Coding
Without a standardized naming convention, the MRO standard is noun-modifier-attribute format, e.g., “BEARING, BALL, 25MM ID, 52MM OD”, search and identification are unreliable.
Technicians who cannot find a part in the system buy it again, even when it is in stock. This pattern drives both excess inventory and emergency procurement simultaneously.
UNSPSC (United Nations Standard Products and Services Code) is the standard taxonomy for MRO classification. Most organizations have partial, inconsistent, or entirely missing UNSPSC coding, which prevents meaningful spend analytics and category management.
Supplier consolidation, contract negotiation, and tail spend management all depend on being able to answer “what are we buying, in which category, from how many suppliers.”
Catalogue Cleanse ROI & Ongoing Governance
A full MRO catalogue cleanse, deduplication, standardization, UNSPSC coding, enrichment, typically surfaces a 15–30% inventory reduction opportunity from eliminating duplicate stock positions alone.
The improvement in procurement efficiency from reduced emergency orders and lower per-transaction costs is additive.
The cleanse is not a one-time project. Without ongoing governance, defined processes for new item creation, mandatory duplicate checks, completeness standards, the catalogue returns to its original state within 18–24 months.
See how MRO data governance protects the cleanse investment over time.
MRO Inventory KPIs That Actually Matter
Aggregate MRO metrics are almost meaningless because the five categories behave so differently.
A single fill rate across the entire MRO portfolio tells you nothing, the category producing stockouts could be 0.1% of spend and represent 80% of downtime risk.
KPIs must be segmented by category to be actionable.
| KPI | What It Measures | Why Category Level Matters | Target Range |
|---|---|---|---|
| Fill Rate by Category | Order lines fulfilled from stock on first request | Critical spare parts require 98%+; consumables 95%+ | 95–99% |
| Transaction Cost per PO | Fully loaded cost to process one purchase order | MRO tail drives cost; manual vs. e-proc gap is $50–$125 | <$25 with e-proc |
| Emergency Purchase Rate | % of MRO spend on unplanned or rush orders | 2–4× cost premium; signals broken replenishment logic | <5% of MRO spend |
| Dead Stock as % of Value | Inventory value with zero consumption ≥24 months | Must distinguish obsolete vs. insurance spares—action differs | <10% |
| Tail Spend Under Management | % of MRO spend through contracted channels | Rogue spend concentrates in long-tail categories | >85% |
| Parts-Caused Downtime Hours | Downtime directly attributable to parts unavailability | Ultimate measure of MRO inventory management outcomes | ↓ QoQ |
| Catalogue Data Quality Score | % of items with complete, standardized descriptions | Foundation KPI—all other KPIs degrade without data quality | >90% |
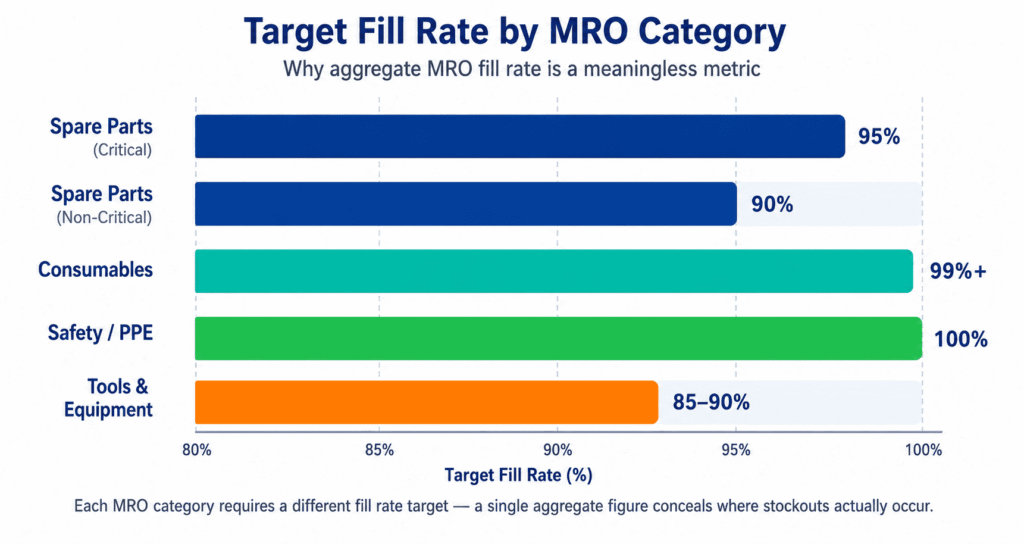
Measuring fill rate as a single aggregate number across all MRO categories hides critical performance gaps. A 95% aggregate fill rate can coexist with a 70% fill rate on critical spare parts if consumable fill rates are near 100%. Category-level measurement is not optional; it is the only way to direct improvement effort at the right problem.
Industries Where MRO Inventory Management Determines Operational Performance
MRO inventory complexity scales with asset intensity, plant count, and the consequences of equipment failure.
The industries below share a common profile: fixed assets are large and expensive, downtime is disproportionately costly, and MRO inventory spans tens of thousands of SKUs across multiple sites.
See how MRO360 manages inventory across all five MRO categories
Verdantis works with Fortune 500 and Global 2000 industrial organizations across oil and gas, mining, and manufacturing.
From Understanding MRO to Managing It - What Software Built for MRO Actually Does
The discipline above describes what good looks like. This section covers how to evaluate whether a software system can deliver it and what separates MRO-native platforms from generic inventory systems with an MRO label.
What MRO Inventory Management Software Should Do - And What Most Doesn't
The core distinction is between MRO-native software, built from the ground up for maintenance inventory, and general inventory software with MRO-specific configuration applied. Most platforms in the market are the latter. The difference is not cosmetic.
MRO software must address two fundamentally distinct problems simultaneously.
Problem 1: Physical inventory management
What you have, where it is, how much to hold, when to reorder, and how to handle multi-site visibility, transfers, and cycle counting. This is a storeroom and supply chain problem. CMMS and ERP systems address it with varying levels of MRO-specific sophistication.
Problem 2: Procurement and spend management
What you buy, from whom, at what price, through what process, and whether it is going through contracted suppliers at contracted prices. This is a procurement and commercial problem. P2P platforms and indirect procurement tools address it, often with limited physical inventory capability.
Most industrial organizations need both problems addressed. Most single systems address only one well.
The gap between the two is where MRO management cost accumulates, where stockouts and rogue spend coexist, and where the promised ROI from software implementations fails to materialize.
Multi-Category Inventory Logic
Different replenishment rules, reorder triggers, and transaction workflows per MRO category. Consumables run on min/max. Critical spares run on criticality-weighted safety stock. The system distinguishes between the two.
Contract Compliance and Spend Visibility
Spend analytics by category, supplier, and site. Non-contracted purchases are flagged or blocked at the requisition stage. Emergency purchase rates are tracked separately from planned spend.
Maintenance System Integration
Work order demand signals, planned maintenance reservations, shutdown kitting, and real-time inventory updates from maintenance execution.
Catalogue Governance
Duplicate detection, standardized item creation, UNSPSC support, and continuous catalogue quality monitoring instead of one-time cleansing.
The MRO software label problem: many general inventory platforms carry an “MRO module” that applies standard replenishment logic uniformly across all MRO categories. A system that manages a box of cable ties the same way it manages a $15,000 pump seal has not been designed for MRO. It has been relabelled for it.
The evaluation section of this page provides specific questions to test during vendor demonstrations that reveal which category a given product actually falls into.
The MRO Software Architecture Decision Framework
Most buyers evaluate MRO software without first establishing which architectural model fits their organization. This leads to shortlisting the wrong platforms entirely.
Four MRO software architectures exist in the market, each with genuine strengths and real limitations.
| Architecture Model | What It Means | Best Fit | Key Limitation |
|---|---|---|---|
| ERP-Native MRO | Full MRO managed within ERP (SAP MM/WM, Oracle). | Large enterprises with multi-site operations and strong finance integration requirements. | Configuration complexity; ERP is not purpose-built for MRO storeroom operations. |
| CMMS-Led with Inventory Module | MRO managed within the CMMS (Maximo, SAP PM, Infor EAM). | Organizations where maintenance-driven demand dominates and work order integration is the highest priority. | Strong on spare parts but weaker on consumables, PPE, tools, and procurement integration. |
| Dedicated MRO Platform | Purpose-built MRO platform integrating both ERP and CMMS. | High SKU environments requiring specialist MRO capabilities and advanced inventory optimization. | Requires integration effort and introduces another enterprise application. |
| Procurement-Led MRO Platform | MRO managed through an indirect procurement platform (Coupa, Ariba). | Organizations focused primarily on tail-spend reduction and procurement efficiency. | Excellent procurement workflow but limited physical inventory and maintenance capabilities. |
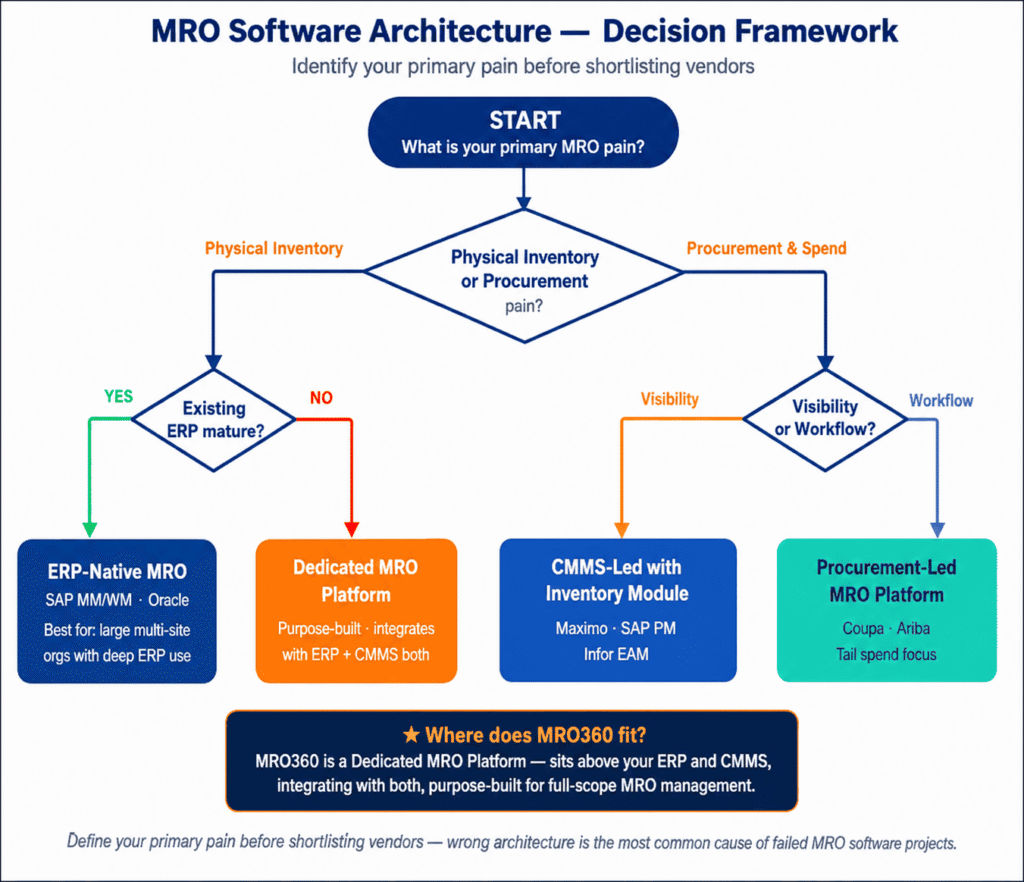
Is the primary MRO pain point physical inventory management (what you have, where it is, and stocking levels) or procurement and spend management (what you buy, from whom, and at what cost)? These are related but distinct pain points, and different architecture models address them at different levels of depth. Identify which pain point is costing more before shortlisting vendors.
MRO360: AI-Native Platform Purpose-Built for Industrial MRO
MRO360 is Verdantis’ AI-native Enterprise Asset Management platform, and the only platform in its category with contractually guaranteed savings.
In the architecture framework above, MRO360 is the Dedicated MRO Platform model: it deploys in 8-12 weeks as an intelligence layer above any existing ERP, CMMS, or EAM stack, integrating bidirectionally with SAP, Oracle, Maximo, Infor EAM, and other major systems without replacing any of them. No system replacement is required.
The platform runs nine sequential modules, each feeding the next. Patented AI algorithms handle the analytical workload. Maintenance professionals validate, override, and refine.
Every planner override is captured as training data and propagated as institutionalised knowledge across every plant in the network, building inventory intelligence that compounds with each deployment cycle.
Shaft Bearing
Stock: 2 | ROP: 5
Critical • Purchase Requisition Required
Mechanical Seal
Stock: 0
Interplant Transfer Available (Plant B: 6)
Gate Valve 4"
Stock: 3 | ROP: 4
Lead Time: 14 Days
Oil Filter Element
Overstock Review Required
22kW Motor Assembly
Transfer Completed
This walkthrough shows MRO360 handling a full MRO inventory cycle in a live industrial environment: parts search and identification, criticality scoring, maintenance demand forecasting, and dynamic reorder point generation.
Why the models are accurate: Verdantis has been processing industrial MRO data since 2004, across oil and gas, mining, and manufacturing enterprises globally. MRO360 launched in 2022, built on 18 years of data quality expertise and first-party MRO datasets that no platform built from scratch can replicate.
MRO360 agents are trained on maintenance inventories, failure patterns, work orders, supplier and OEM catalogues, and first-party ERP data — not on generic enterprise datasets. The accuracy of the models reflects the specificity of what they were trained on.
AI handles the analysis, calculation, and data action. Each output surfaces the reasoning behind it. Maintenance professionals review and approve. Every correction becomes a training signal. The system gets more accurate with each cycle and each expert override.
Search and Visibility
NLP semantic search across all parts, materials, and assets at every plant. A planner searching "pump seal gasket" surfaces records named "GSKT-PUMP-SS316", "seal gasket centrifugal", and "pump sealing ring" without requiring exact wording. Bin location, inventory level, manufacturer, and certified substitutes remain visible across every connected facility.
Parts invisibility is one of the biggest causes of emergency purchasing. This module removes that problem before planning, forecasting, or optimization begins.
Explore Spare Parts Management →Criticality Scoring
Every spare part receives an AI-generated criticality score using production impact, safety consequence, supplier lead time, equipment dependency, failure history, replaceability, and maintenance strategy. Each item is evaluated individually instead of assigning a single score to an entire asset.
Every recommendation includes a written explanation, while planner overrides become learning signals that continually improve future recommendations across the enterprise.
See Critical Spares Management →Maintenance Demand Forecasting
Forecasts distinguish preventive maintenance demand from corrective maintenance using work orders, asset age, equipment utilization, historical failures, maintenance schedules, and seasonal operating patterns.
Planned shutdown demand is modeled independently from routine consumption, producing significantly more accurate inventory planning than traditional statistical forecasting alone.
See Demand Forecasting →Cross-Enterprise Transfer
Before creating a purchase order, MRO360 searches inventory across every connected warehouse and production site. Available surplus inventory is recommended for transfer before external procurement is initiated.
Enterprise-wide inventory pooling reduces duplicate purchasing, improves inventory utilization, and minimizes capital locked in slow-moving stock.
Explore MRO360 →Work Order Planning
Thousands of work orders are automatically prioritized using equipment criticality, spare availability, supplier lead times, shutdown windows, and maintenance priority. Material reservations are created automatically.
Maintenance planners spend their time reviewing exceptions instead of manually coordinating every work order and spare part requirement.
See Work Order Software →Dynamic Reorder Point
Reorder points continuously adapt as supplier lead times, demand variability, maintenance schedules, and criticality scores change. Every recommendation reflects current operating conditions instead of static minimum and maximum values.
Dynamic replenishment significantly reduces excess inventory while protecting plants from unexpected stockouts during critical maintenance.
See Spare Parts Management →Core capabilities of MRO inventory management software
An MRO-native platform must address all capability areas below. Gaps in any area signal either a general-purpose system relabelled for MRO or a system purpose-built for one architectural model applied outside its scope.
| Capability | Purpose | Coverage |
|---|---|---|
| Network-level demand pooling | Identify parts slow at each site but fast across the network; enable central pooling rather than duplicated local stocks | MRO-native |
| Inter-site transfer management | Transfer excess stock from one site to meet a stockout at another before raising an external PO | Variable |
| Site vs. consolidated view toggle | Planners see their site inventory or the full network position for any given part number | MRO-native |
| Multi-site KPI reporting | Fill rate, emergency purchase rate, dead stock, and catalogue quality reported per site and consolidated | Variable |
| Centralized catalogue governance | Item master standards enforced across all sites from a central catalogue authority | MRO-native |
MRO E-Procurement and Catalogue Integration
The procurement dimension of MRO software is almost entirely absent from MRO inventory content, yet it is essential for buyers whose primary pain is transaction cost, rogue spend, or tail spend management.
Live supplier catalogue access from within your procurement system
Punch-out integration allows users to browse a supplier's live catalogue directly from the buying organization's procurement system, with prices and availability reflecting real-time negotiated terms. This is the correct solution for high-variety MRO consumables where maintaining an internal catalogue requires constant updates that never quite keep pace with supplier changes.
Blocking or flagging non-contracted purchases before they happen
MRO is the category most prone to rogue spend: purchases made outside contracted suppliers or at non-contract prices. Software with contract compliance checking flags or blocks non-contracted purchases at the requisition stage, before the spend occurs. Moving tail spend to contracted suppliers typically yields 8–15% cost reduction on the affected spend.
Category, supplier, site, and contract compliance analytics
The ability to analyze MRO spend by category, supplier, site, and department is the prerequisite for supplier consolidation and contract negotiation. Many CMMS systems have limited analytics capability, forcing reliance on ERP exports and manual BI reporting that becomes stale within 60–90 days.
Systems that show only inventory miss half the MRO problem
A system that shows only inventory positions without procurement data gives a practitioner half the picture. MRO management requires visibility of stock, on-order items, spend, and contracted vs non-contracted purchases in one unified view.
Evaluating MRO Inventory Management Software
Separating MRO-Native from MRO-Labelled
The following red flags and demonstration questions are specific to organizations evaluating software for the full MRO scope, not only spare parts.
A system that clears all five red flags and answers all four demo questions satisfactorily has demonstrated MRO-native capability across both the physical inventory and procurement dimensions.
No distinction between consumable and spare part management
A system that routes a box of cable ties through the same replenishment logic as a $15,000 pump seal has not been designed for MRO. Consumables and spare parts require different logic, workflows, and supplier strategies.
No multi-category analytics
The system should report inventory value, turnover, fill rate, and stockout performance separately by MRO category. Aggregated dashboards are misleading because MRO categories behave very differently.
No catalogue management capability or supplier integration
A system that cannot enforce item master standards, support UNSPSC coding, or connect to supplier catalogues will not fix catalogue chaos. It will inherit it.
No planned shutdown or turnaround planning support
Systems without bulk material planning for shutdowns are not designed for industrial MRO environments. Turnarounds create demand spikes that standard reorder logic cannot handle.
Reporting limited to inventory positions only
MRO requires visibility across stock, on-order items, spend, and contracted vs non-contracted sourcing. Inventory-only systems provide an incomplete operational picture.
Four questions to ask in every demo
Request these specific demonstrations. A vendor who cannot show any of the four scenarios has not designed their product for the full MRO scope. A vendor who shows all four has likely built for it.
-
1Show me how you manage a fast-moving consumable differently from an insurance spare. A system without category-differentiated replenishment logic, different demand models, different safety stock calculations, and different supplier management has not been built for MRO. It has been adapted from a generic inventory platform.
-
2Show me how a planned maintenance shutdown generates material requirements in advance. Shutdown planning requires bulk reservations, pre-kitting logic, and supplier commit workflows months ahead of the event. If the system has no concept of this planning mode, it cannot manage industrial MRO.
-
3Show me how you handle a part with zero consumption over 24 months. What does the system recommend and why? A system that automatically flags zero-consumption items for disposal will liquidate critical insurance spares. It must distinguish between dead stock and insurance spares using criticality and asset data.
-
4Show me spend analytics by MRO category with contract compliance visibility. If the system shows only aggregate inventory value and movement, it cannot support supplier consolidation, contract negotiation, or tail spend management.
Building the Business Case for MRO Inventory Management Software
The ROI levers below apply specifically to full-scope MRO platforms. A business case built only on spare parts improvements typically understates the real return by a factor of two or more, because it misses the transaction cost, tail spend, and consumable management benefits.
Payback periods reflect typical deployments in heavy-asset industrial environments. Actual timelines depend on data quality, integration complexity, and scope of change management required.
MRO360 delivers the ROI levers above as a nine-module AI-native workflow: parts search and visibility eliminates the information gap driving emergency spend; criticality scoring right-sizes safety stock at part level; cross-enterprise transfer recovers working capital across plants before any external PO is raised; and dynamic reorder points eliminate both overstock and stockout simultaneously.
Verdantis deployment benchmark: 20–35% working capital released on first deployment and 50–70% reduction in emergency procurement spend within 12 months. Savings are contractually guaranteed, depending on operational maturity. 200+ implementations across Fortune 500 and Global 2000 clients in oil and gas, mining, and manufacturing.
See MRO360 in actionWe will show what the analysis finds.
Verdantis runs a no-obligation diagnostic on a sample of your MRO inventory data before any commitment.
Frequently Asked Questions (FAQs)
What is MRO inventory management?
MRO inventory management is the discipline of planning, controlling, and optimizing stock across all maintenance, repair, and operations categories, spare parts, consumables, tools, PPE, and indirect materials, to ensure the right item is available for every maintenance event, at every site, without tying up working capital in excess or redundant stock.
It is distinct from spare parts management, which covers only one of the five MRO categories.
What is the difference between MRO inventory management and spare parts management?
Spare parts management is a subset of MRO inventory management. MRO covers five categories, spare parts, consumables, tools and equipment, safety/PPE, and indirect materials.
Spare parts management focuses specifically on the intermittent, failure-driven demand segment: criticality assessment, ROP calculation, insurance spare decisions, and rotable parts management.
The two disciplines share some methods but require different software capabilities and different KPIs.
What does MRO inventory management software do?
MRO inventory management software addresses two related but distinct problems: physical inventory management (what you have, where it is, what levels to maintain, and when to reorder) and procurement and spend management (what you buy, from whom, at what cost, through what process).
Purpose-built MRO software handles both, integrates with ERP and CMMS systems, supports multi-site visibility, and applies category-differentiated management logic across all five MRO item types.
How is MRO inventory management software different from a CMMS?
A CMMS manages maintenance work orders, PM schedules, and technician activities. Its inventory module covers spare parts associated with specific assets and work orders.
It is strong on the maintenance side but generally weak on consumables, PPE, tools, and the procurement dimension.
MRO inventory management software integrates with the CMMS to receive work order demand signals, while adding the full inventory management and procurement visibility layer that CMMS systems rarely provide at full scope.
How do you reduce MRO inventory costs?
MRO inventory cost reduction operates across the Total Cost of MRO Ownership framework, not just unit price. The highest-ROI levers are:
(1) catalogue deduplication and standardization, which typically uncovers 15–30% duplicate part numbers and enables 10–20% inventory value reduction;
(2) criticality-based stocking, which right-sizes safety stock to actual risk;
(3) demand forecasting that separates preventive from corrective demand, reducing emergency procurement; and
(4) moving MRO tail spend to contracted, catalogue-enabled channels, reducing both transaction cost and price variance.
How long does MRO inventory management software implementation take?
A focused deployment covering spare parts inventory and work order integration in a single-site environment typically takes 3-6 months.
A full multi-site MRO platform covering all five categories, integrating with ERP, CMMS, and procurement systems, and including a catalogue cleanse, typically takes 9-18 months.
Catalogue data quality at the start of the project is the single greatest determinant of timeline and post-go-live performance.
What is MRO storeroom management and how does it differ from MRO inventory management?
MRO storeroom management covers the physical operations of the storeroom: facility design and layout, staffing models, receiving and issuing procedures, cycle counting schedules, and physical security.
MRO inventory management covers what is held, at what quantities, sourced from whom, and at what total cost. The two disciplines overlap in practice but address different problems.
A well-run storeroom with poor inventory decisions produces excellent execution of the wrong stocking strategy.
Optimized inventory levels managed through a poorly run storeroom produce correct decisions that cannot be executed reliably. Both are required. For dedicated coverage of storeroom operations, see the MRO storeroom management resource.