Una línea de producción de una gran fábrica se detiene de repente. Una bomba crítica del sistema de refrigeración falla sin previo aviso. Cuando la cinta de producción empieza a calentarse, los operarios se ven obligados a parar todo el proceso. Lo que sigue es una reacción en cadena, que empieza con la mano de obra ociosa y el incumplimiento de los plazos de entrega, y culmina con la agilización de las piezas de repuesto y el aumento de la presión.
¿Sabe que los tiempos de inactividad imprevistos cuestan a los fabricantes estadounidenses hasta 1.000 millones de euros? $207 millones por semana? Y hasta 55% de las empresas se enfrentan a estos escenarios una vez al año.
¿Y si este tiempo de inactividad pudiera planificarse? Muchas industrias que utilizan muchos activos ya tienen tiempos de inactividad planificados en sus estrategias. Suelen ser para mantenimiento planificado cuando los activos no están en uso o similares. Sin embargo, las organizaciones también pueden evitar los tiempos de inactividad imprevistos mitigando los sucesos inesperados. Y ahí es donde entra en juego la monitorización de estado.
Si se pregunta qué es la monitorización de estado, se trata del proceso de seguimiento continuo o periódico del estado de la maquinaria o los equipos. Esto se hace con la ayuda de sensores que capturan datos sobre los factores de salud de un activo, como la vibración, el aceite, la temperatura y la presión. A partir de estos datos, los equipos de mantenimiento pueden detectar anomalías respecto al comportamiento normal de funcionamiento.
Cómo la monitorización basada en el estado cambia la mentalidad del mantenimiento
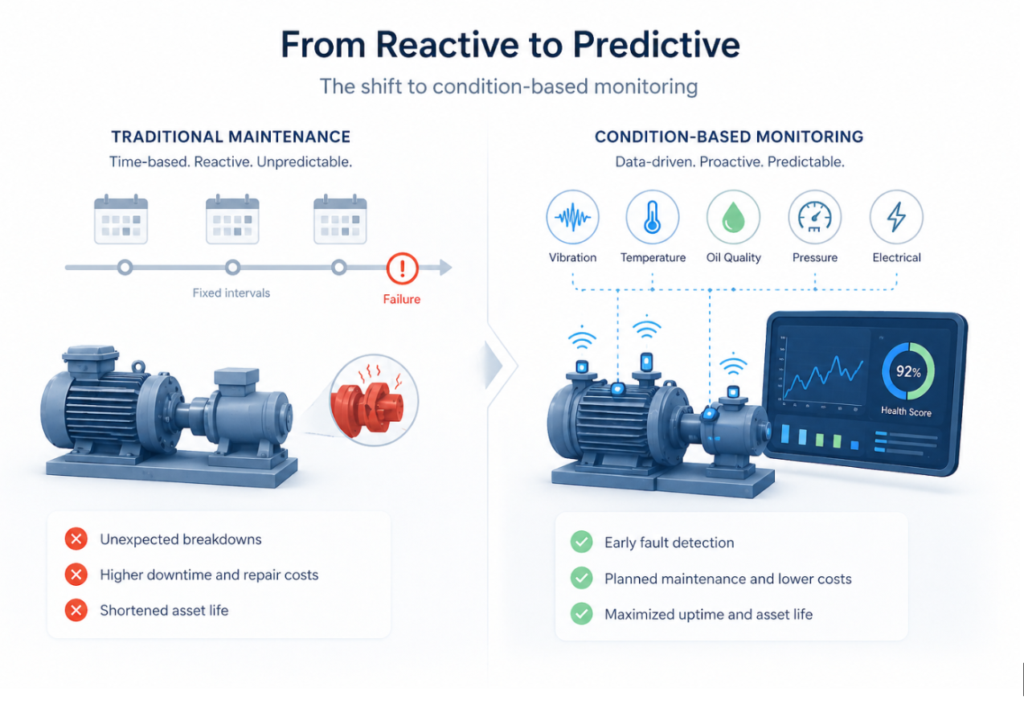
Los equipos nunca son previsibles y, sin embargo, la mayoría de las estrategias tradicionales se basaban en la previsibilidad. Los equipos se basaban en calendarios fijos basados en la previsibilidad de los fallos. Por ejemplo, una máquina más propensa a los fallos recibiría mantenimiento dos veces al mes. Algo como un rodamiento, en cambio, se sustituirá cada seis meses.
Aunque este enfoque ofrece una estructura, también introduce ineficiencias. ¿Qué ocurre si un componente de un sistema se sustituye antes de lo previsto? ¿Y si un componente falla porque nunca se ha evaluado su estado en tiempo real?
La monitorización de las condiciones cambia esta situación desde su base. En pocas palabras, cambia todo el enfoque de cuándo debe realizarse el mantenimiento a por qué debe realizarse.
Este cambio introduce una expectativa operativa de referencia para una máquina o un activo. Con el tiempo, los sensores ayudan a seguir las desviaciones de ese punto de referencia, lo que permite a los equipos de mantenimiento ser proactivos. En lugar de esperar a que se produzca un fallo y reaccionar, el mantenimiento puede comenzar en cuanto aparecen los problemas.
Debido a este cambio, la demanda de sistemas de monitorización de condiciones está aumentando en todo el mundo. Según Fortune Business InsightsEn 2025, el valor del mercado ascendía a 1.400 millones de PTT. Con una CAGR de 9,7% de 2026 a 2034, se estima que se duplicará con creces y alcanzará los $6.800 millones.
Este cambio no consiste únicamente en pasar de un mantenimiento basado en el calendario a otro basado en la condición. También se trata de pasar de indicadores retrospectivos a indicadores adelantados y de un mantenimiento reactivo a una planificación proactiva.
La tabla siguiente muestra cómo la supervisión basada en la condición desplaza a toda la organización de mantenimiento:
| Característica | Control tradicional | Supervisión basada en las condiciones |
|---|---|---|
| Activador primario | Esta supervisión se basa en calendarios fijos, por lo que la inspección durante uno de esos ciclos o el fallo total será el punto de activación | Los activadores se basan en umbrales en tiempo real |
| Conocimiento de los activos | Los planes de mantenimiento se curan basándose en las recomendaciones generales del fabricante | El conocimiento de las constantes vitales de cada activo se recoge en tiempo real |
| Cultura de equipo | Los equipos son recompensados por arreglar las cosas rápido | Aquí, la recompensa no es por arreglar, sino por mantener las cosas en funcionamiento |
| Inventario | Existencias basadas en patrones históricos de compra | El inventario se optimiza en el momento adecuado en función del estado de los activos y la predicción de fallos |
Una visión multiparamétrica de la vigilancia de activos
Aunque es posible que los equipos fallen por una sola razón, no suele ser así. Pueden producirse simultáneamente cambios mecánicos, térmicos y químicos. Por eso es importante tener en cuenta varios aspectos del estado de un activo a la vez. La monitorización del estado de los activos facilita esta tarea mediante el seguimiento de diferentes parámetros de salud.
Cada uno de estos parámetros da una idea de cómo funciona una máquina en tiempo real. La temperatura, por ejemplo, pone de manifiesto el estrés térmico y la pérdida de energía, y es uno de los primeros signos de avería. Indica un aumento de la fricción en los rodamientos, resistencia eléctrica en los motores o una menor eficacia de la refrigeración.
La presión, por su parte, proporciona información sobre el flujo de fluidos. Por ejemplo, una caída de presión indica una fuga en alguna parte, mientras que un pico podría significar resistencia o una obstrucción.
Los parámetros de calidad del aceite también sirven como medios de diagnóstico para obtener pruebas directas desde el interior de la máquina. La viscosidad influye en el rendimiento de la lubricación, las partículas metálicas señalan el desgaste y la contaminación por agua acelera la corrosión. Dado que cada desequilibrio, desalineación, holgura y defecto de los rodamientos genera patrones de frecuencia únicos, la vibración se convierte en otro factor rico en información.

Todos estos parámetros pueden proporcionar información sobre el fallo de la máquina en una fase temprana. Sin embargo, lo mejor es interpretar estas señales conjuntamente. Así obtendrá una visión holística del problema. A través de esta visión, puede trabajar con los equipos de mantenimiento e ingeniería para identificar y abordar los problemas en sus causas fundamentales.
Técnicas de Condition Monitoring
Como se ha señalado en la sección anterior, son múltiples los parámetros de los equipos que hay que vigilar. Y para ello se utilizan diferentes técnicas, cada una de las cuales aprovecha un tipo diferente de sensor para recopilar la información pertinente. Saber qué técnica es la más adecuada para detectar qué anomalías facilita enormemente todo el proceso de supervisión basada en el estado.
Control de vibraciones
El análisis de las vibraciones de la maquinaria rotativa es una de las técnicas de monitorización de estado más antiguas y utilizadas. Según Perspectivas futuras del mercadoLa cuota de mercado de los sistemas de monitorización de estado se sitúa en torno al 30,6%.
Los sensores utilizados para esta técnica de control se denominan acelerómetros. Recogen datos de vibración que puedes procesar utilizando el análisis del espectro de frecuencias, así como la detección de envolventes.
El objetivo principal de estos sistemas es detectar desequilibrios, desalineaciones del eje y otros problemas mecánicos en fases tempranas.
Vigilancia electromagnética
La vigilancia electromagnética rastrea las variaciones del campo magnético, por lo que sólo funciona en equipos eléctricos. El resultado del análisis de esta técnica se asocia al flujo de corriente en un motor, o a cómo interactúa el rotor con el estator.
Los sensores utilizados aquí recogen datos de patrones de flujo y emisiones electromagnéticas de una máquina en marcha. Estas señales pueden analizarse para detectar asimetrías o distorsiones.
La vigilancia electromagnética es la mejor en detección:
- Rotura de las barras del rotor
- Averías en el bobinado del estátor
- Excentricidad del entrehierro
- Desequilibrio eléctrico
Esta técnica es valiosa para una visión global porque detecta fallos internos del motor sin necesidad de apagarlo o desmontarlo.
Termografía infrarroja
Esta técnica permite visualizar la distribución de la temperatura, un indicador clave del estado de la máquina. Cuando un equipo tiene que hacer un esfuerzo adicional para ofrecer un rendimiento estándar, empieza a calentarse. Detectar a tiempo este aumento de temperatura puede indicar posibles problemas subyacentes que, si no se tratan a tiempo, pueden provocar averías.
Además de los sensores, también se utilizan cámaras para recopilar datos de termografía de infrarrojos. Estas cámaras de infrarrojos capturan imágenes térmicas para determinar con precisión dónde se genera más calor. Si el nivel de calor supera un umbral determinado, la solución de monitorización del estado puede activar una alerta automática para el equipo de mantenimiento.
Con esta técnica, puede detectar la degradación del aislamiento, el sobrecalentamiento de los rodamientos y el bloqueo del flujo de aire o problemas de refrigeración.
Interferometría láser
Como su nombre indica, esta técnica utiliza rayos láser para detectar anomalías en diferentes patrones. Dado que consiste en crear y supervisar patrones con rayos láser, es una de las técnicas de supervisión de estado más precisas.
Puede rastrear cambios hasta la escala de micras o nanómetros. Por eso es tan popular en sectores en los que la precisión afecta a la calidad del producto, como el de los semiconductores o el aeroespacial. Pero, aunque es muy eficaz y preciso, también es ligeramente costoso de implantar.
Si se instala correctamente, puede detectar desalineaciones del eje, microvibraciones y deformaciones estructurales bajo carga.
Análisis del aceite
Si desea comprobar el rendimiento interno de una máquina, el análisis del aceite es una forma sencilla de hacerlo. Examina el lubricante a medida que se desplaza por el sistema. Y por eso, el aceite también transporta todas las pruebas de desgaste y corrosión a través de la máquina.
La mayoría de las demás técnicas de esta lista requieren sensores, pero no ocurre lo mismo con el análisis del aceite. En este caso, las muestras de aceite se recogen y procesan en laboratorios. Sin embargo, los sensores en línea pueden seguir presentes y rastrear parámetros como la viscosidad y el recuento de partículas.
Esta técnica es la mejor para detectar:
- Desgaste de engranajes y cojinetes
- Contaminación
- Avería de lubricante
- Daño interno en fase inicial
Ensayos de emisiones acústicas
La acústica tiene que ver con la frecuencia, y eso es lo que detectan las pruebas de emisiones acústicas. Todas las máquinas generan alguna frecuencia, ya sea por fricción, rotación o deformación del material. Independientemente de la causa, la frecuencia generada puede controlarse y compararse con los datos de referencia mediante sensores que detectan ondas elásticas transitorias.
Estos sensores son los mejores para detectar la formación de grietas o la fricción superficial. Aparte de eso, también detecta a tiempo defectos en los rodamientos y la concentración de tensiones estructurales.
Análisis ultrasónico
El análisis ultrasónico se centra en las ondas sonoras de alta frecuencia que no son audibles para el ser humano. Los sensores utilizados en esta técnica pueden ser portátiles o fijos. Captan las ondas ultrasónicas, que luego se convierten en formatos sonoros o visuales para su análisis.
El mejor caso de uso del análisis por ultrasonidos es la detección de anomalías en sistemas mecánicos y eléctricos. Puede detectar aire comprimido, fugas de gas, fugas de vapor y arcos eléctricos.
Análisis radiográfico
La radiografía utiliza rayos X o gamma para detectar cualquier problema en el interior de un equipo sin desmontarlo. Al igual que en el diagnóstico médico por imagen, las imágenes se crean en función del paso de los rayos por el equipo. Esto permite detectar incoherencias comparando los resultados con los datos de referencia.
El mejor detectando:
- Grietas internas
- Vacíos e inclusiones
- Defectos de soldadura
- Irregularidades estructurales
Esta técnica es muy popular en aplicaciones de alto riesgo en las que la integridad interna es crítica, como recipientes a presión y tuberías.
Análisis de firmas eléctricas
Los fallos del rotor, los desequilibrios de carga, las perturbaciones de la calidad de la energía y otros defectos producen formas de onda eléctrica variables. El análisis de la firma eléctrica puede monitorizarlas todas para detectar anomalías. Este método permite supervisar los equipos sin instalar sensores mecánicos adicionales.
Además de las mencionadas en esta lista, existen otras técnicas de monitorización de estado que puede utilizar. Por ejemplo, la monitorización de impulsos de choque para medir las ondas de impacto, el análisis de residuos de desgaste basado en las partículas presentes en los lubricantes y la monitorización de descargas parciales para detectar pequeñas descargas eléctricas en los sistemas de aislamiento.
Cómo funciona el Condition Monitoring
La monitorización de estado comienza en la interfaz física entre un sensor y el activo que vigila. Sin embargo, esa no es la única parte. Una vez instalados los sensores y recopilados los datos, los equipos de MRO deben aprovecharlos, procesar las señales e introducirlas en un EAM o CMMS.
Este proceso permite a los equipos de gestión supervisar el estado de un activo y utilizar esa información para prolongar su vida útil emitiendo automáticamente órdenes de trabajo para las máquinas que no funcionan de forma óptima.
Detección y adquisición de datos
Cada información producida, cada orden de trabajo activada y cada fallo interceptado tiene su origen en esta capa. Como hemos visto en la sección anterior, hay distintos tipos de técnicas de monitorización de estado, y cada una requiere un tipo de sensor diferente.
Por lo tanto, su primera tarea importante es seleccionar e instalar los sensores adecuados en los activos que desea rastrear. Por ejemplo, los sensores de vibración recopilarán datos de desplazamiento, velocidad y aceleración.
El desplazamiento es más informativo en máquinas grandes, como papeleras o excavadoras. Esto es especialmente cierto en frecuencias bajas, como por debajo de 10 Hz. En cambio, la velocidad se utiliza para frecuencias medias, entre 10 Hz y 1 kHz, y la aceleración para diagnósticos de alta frecuencia.
La tabla siguiente representa los distintos tipos de sensores utilizados para capturar diferentes datos de vibración:
Tipo de sensor | Gama de frecuencias | Sensibilidad | Ruido de fondo | Mejor aplicación |
|---|---|---|---|---|
Piezoeléctrico (IEPE) | 0,5 Hz - 20 kHz | 10-1000 mV/g | Muy bajo | Rodamientos o cualquier máquina rotativa |
MEMS (sistemas microelectromecánicos) capacitivos | CC - 5 kHz | 100-1000 mV/g | Moderado | Máquinas de baja velocidad |
Sonda de proximidad de corrientes de Foucault | CC - 10 kHz | 7,87 V/mm | Bajo | Esto es bueno para el desplazamiento del eje y cojinetes de deslizamiento |
Vibrómetro láser | CC - 1 MHz+ | Puede variar mucho | Muy bajo | Las superficies calientes o inaccesibles pueden controlarse |
Sensor de velocidad (geófono) | 1 Hz - 1 kHz | 20-80 V/(m/s) | Bajo | Control estructural de baja frecuencia |
Del mismo modo, existen diferentes tipos de sensores para recopilar diferentes datos. Si no está completamente seguro, puede seguir el marco de la norma ISO 17359:2018, que proporciona directrices para establecer programas de monitorización de estado, incluida la selección de sensores. Principalmente, los pasos son enumerar los modos de fallo de un activo, identificar los parámetros medibles que cambian a medida que se desarrolla cada modo de fallo y, a continuación, seleccionar la tecnología de sensores capaz de medir esos parámetros.
Conectividad y transporte de datos
El siguiente reto es transferir los datos de los sensores a un sistema capaz de analizarlos. Las señales en bruto de los sensores son simplemente valores que, en industrias con muchos activos, pueden cambiar cientos de veces en un segundo. Y transferir estos datos es también mucho más difícil en un entorno tan ruidoso eléctricamente y con una infraestructura de red físicamente más alejada que, por ejemplo, en una empresa de TI.
Ahora, esta transmisión puede realizarse a través de una infraestructura cableada o inalámbrica.
Bus de campo cableado y transmisión analógica
Utilizar cables para transferir datos es el método más antiguo y sigue siendo uno de los más fiables. Utiliza un bucle de corriente analógica de 4-20 mA. Este 4-20 mA es el bucle de corriente analógica DC en el que el transmisor convierte las señales medidas. Aquí, 4 mA representa el valor más bajo, o 0%, del rango de medición, y 20 mA representa el más alto, o 100%. La transferencia de datos como corriente continua en lugar de tensión hace que la señal sea inmune a la caída de tensión en cables largos.
A continuación, esta información se transmite y procesa a través de un sistema como el Transductor Remoto Direccionable en Carretera (HART). HART añade a las señales información relevante como el estado del sensor, el identificador de la etiqueta y otras variables secundarias.
Redes industriales inalámbricas
La instalación de sensores por cable en una planta grande es cara. Por eso, muchos optan por opciones inalámbricas, como WirelessHART o ISA100.11a.
Como su nombre indica, WirelessHART es la extensión inalámbrica del protocolo HART. Funciona en la banda ISM de 2,4 GHz utilizando radios IEEE 802.15.4. Utiliza una red de malla de Acceso Múltiple por División en el Tiempo. En esta red, cada dispositivo es también un enrutador, lo que proporciona una topología de red autoorganizada y autorreparable.
ISA100.11a es simplemente una alternativa a WirelessHART y realiza la misma función.
A continuación se explica cómo se pueden elegir los distintos protocolos de las redes cableadas e inalámbricas en función de los diferentes casos de uso:
Protocolo | Capa física | Ancho de banda | Tasa de actualización | Caso práctico |
|---|---|---|---|---|
4-20 mA | Es un cobre de dos hilos | Variable única (analógica) | Continuo | Transmisores de proceso sencillos |
HART | Sigue un bucle de 4-20 mA | 1200 bps (superposición digital) | A la carta | Diagnóstico de dispositivos 4-20 mA existentes |
PROFIBUS PA | Bus de dos hilos | 31,25 kbps | 100-1000 ms | Buses de campo para automatización de procesos |
EtherNet/IP | Representa la Ethernet industrial estándar | 100 Mbps - 1 Gbps | 1-100 ms | E/S de alta velocidad de controlador a dispositivo |
WirelessHART | Malla 802.15.4 a 2,4 GHz | 250 kbps (compartido) | 1-60 s | Transmisores de proceso inalámbricos |
ISA100.11a | Malla 802.15.4 a 2,4 GHz | 250 kbps (compartido) | 1-60 s | Transmisores de proceso inalámbricos |
5G NR (privado) | Sub-6 GHz / ondas milimétricas | Hasta 1 Gbps | < 1 ms | Supervisión densa a nivel de forma de onda |
Una vez que estos datos están en la red de la planta, deben ser accesibles para los sistemas superiores, como EAM o CMMS. Sin embargo, para que estos sistemas puedan acceder a los datos, éstos deben tener un formato coherente. Y ahí es donde los proveedores de servicios como Verdantis pueden resultar útiles.
La Arquitectura Unificada OPC, publicada como IEC 62541, se ha convertido en el estándar para esta coherencia de datos. Admite las opciones de codificación OPC-UA Binary y OPC-UA XML. A continuación, los datos codificados se transfieren a través de un protocolo de Internet de las Cosas (IoT), como Message Queuing Telemetry Transport (MQTT), que está normalizado como ISO/IEC 20922.
Transformación de señales brutas en funciones de diagnóstico
Los datos de que dispone ahora su equipo representan simplemente cantidades físicas brutas. No indican directamente a un ingeniero de mantenimiento cuál es el problema de la máquina. Para ello, hay que procesarlos y convertirlos en mediciones con significado diagnóstico. Por ejemplo, deben ayudar a identificar en qué parte de la máquina se origina el cambio y qué mecanismo de fallo representa.
He aquí algunos de los métodos de análisis más utilizados para transformar las señales brutas en características de diagnóstico:
Análisis en el dominio del tiempo
La forma más sencilla de analizar señales, sobre todo de vibraciones, es trabajar directamente con la forma de onda temporal. Este método de análisis elimina la necesidad de transformar las señales en frecuencias para observarlas en un espectro. En su lugar, se basa en medidas estadísticas básicas que pueden calcularse a partir de esta señal y utilizarse para supervisar el estado de la máquina.
- RMS (media cuadrática) consiste en medir la energía global de la vibración. Los valores más altos indican que se transmite más energía, lo que puede indicar desgaste o daños. Es más eficaz para detectar problemas en curso y menos eficaz para detectar fallos tempranos.
- Valor máximo y factor de cresta ayudan a capturar impactos cortos que RMS pasa por alto. El factor de cresta es la relación entre el valor pico y el valor RMS. Cuando se producen impactos bruscos, el pico aumenta mientras que el valor eficaz se mantiene bajo. Esto aumenta el factor de cresta y puede desencadenar un problema potencial. Por lo tanto, es útil para detectar defectos tempranos en los rodamientos.
- Kurtosis mide la gravedad de los picos. Al igual que el factor de cresta, funciona bien para la detección precoz de fallos. Sin embargo, tiende a disminuir a medida que el daño se generaliza.
He aquí una tabla que representa el uso del análisis en el dominio del tiempo:
| Métrica | Gama saludable | Umbral elevado | Sensibilidad a los fallos |
|---|---|---|---|
| Métrica | Gama saludable | Umbral elevado | Sensibilidad a los fallos |
| RMS | Específico de la máquina | Límite de la zona ISO | Gravedad general de las vibraciones |
| Factor de cresta | 2.5 – 3.5 | > 6 | Defectos tempranos del rodamiento |
| Kurtosis | ~3 | > 6 (alerta), > 10 (alarma) | Defectos de rodamiento muy precoces |
| De pico a pico | Específico de la máquina | Según ISO/fabricante | Desplazamiento del eje, holgura |
Transformada rápida de Fourier (FFT)
Como su nombre indica, la Transformada Rápida de Fourier convierte. Convierte una señal basada en el tiempo en datos basados en la frecuencia. En lugar de ver cómo cambia la vibración con el tiempo, se ve cuánta energía existe en cada frecuencia. La ventaja es que se pueden identificar fácilmente los fallos de la máquina, ya que muchos problemas se producen en frecuencias predecibles.
La precisión de la FFT depende de la cantidad de datos recogidos. Sigue esta relación:
Resolución (Hz)=Número de muestras / Frecuencia de muestreo
Así, una señal más larga ofrece mejores detalles de frecuencia. El inconveniente, sin embargo, es que requiere más tiempo y puede introducir variaciones no deseadas.
Algunos de los patrones de fallo comunes que puede identificar en la frecuencia utilizando este análisis son:
- Armónicos del eje, que aparecen como múltiplos de la velocidad de rotación.
- Los defectos de los rodamientos pueden identificarse, ya que crean frecuencias específicas basadas en el diseño y la velocidad. Entre ellas se incluyen la frecuencia de la pista exterior (BPFO), la pista interior (BPFI), el giro de la bola (BSF) y la frecuencia de la jaula (FTF).
- Los fallos de los engranajes aparecen en la frecuencia de malla del engranaje (GMF), que se calcula a partir de la velocidad del eje y el número de dientes del engranaje. En este caso, una mayor amplitud de la GMF significa un desgaste uniforme, y las bandas laterales alrededor de la GMF representan daños localizados.
Análisis de la envolvente
El análisis envolvente también se conoce como técnica de resonancia de alta frecuencia (HFRT). El principal uso de este análisis es la detección precoz de defectos en los rodamientos. Un rodamiento dañado produce pequeños impulsos de impacto cada vez que un elemento rodante pasa sobre el defecto.
Como estos impulsos son muy cortos, no aparecen en la frecuencia del defecto. En cambio, muestran defectos en resonancias de frecuencia más alta (2-20 kHz).
Sin embargo, para obtener un análisis correcto de la envolvente, es importante seleccionar la gama de frecuencias adecuada. Eso es algo que puede hacerse utilizando la Curtosis Espectral. La Curtosis Espectral explora las frecuencias para identificar dónde es más impulsiva la señal.
Análisis de ondículas y tiempo-frecuencia
La FFT funciona bien con máquinas que funcionan a una velocidad estándar porque supone que la señal permanece constante. Pero, ¿qué ocurre si los activos funcionan a distintas velocidades o experimentan fallos, paradas y arranques repentinos? En todos estos escenarios, la FFT se queda corta, y es la transformada de Fourier de tiempo corto (STFT) la que acude al rescate.
La STFT divide las señales en segmentos cortos superpuestos. El espectrograma resultante muestra cómo cambia el contenido de frecuencia a lo largo del tiempo. Sin embargo, tiene la limitación de que la mejora del detalle temporal reduce la precisión frecuencial, y viceversa.
Las transformadas wavelet utilizan funciones flexibles que ajustan su tamaño en función de la frecuencia para superar esa limitación. Cuando los componentes de alta frecuencia se capturan con ventanas temporales cortas y los de baja frecuencia utilizan ventanas más largas, las ondículas pueden detectar sucesos breves, como impactos o señales tempranas de fallos.
Análisis de pedidos para máquinas de velocidad variable
Muchos activos, como la cadena cinemática de un vehículo o un aerogenerador, pueden funcionar a distintas velocidades. Por tanto, las vibraciones u otras señales resultantes también pueden cambiar. Esto hace que los gráficos de frecuencia sean desordenados y difíciles de leer porque las señales se dispersan. Pero este cambio no indica necesariamente un problema con el equipo.
El análisis de órdenes resuelve este problema rastreando las señales en el dominio angular, como por rotación, en lugar del dominio temporal. Las señales se controlan con un tacómetro, que registra la velocidad instantánea del eje.
De este modo, las frecuencias se muestran como órdenes en lugar de Hz. El resultado es que los problemas relacionados con la rotación de la máquina permanecen en el mismo lugar del gráfico, aunque cambie la velocidad. Esto facilita enormemente la lectura y comprensión del espectro final por parte de los ingenieros de mantenimiento.
Almacenamiento y gestión de datos de estado a gran escala
Supongamos que una planta de fabricación de tamaño medio necesita supervisar continuamente 200 activos. Cada activo está instrumentado con dos canales de vibración y dos canales de temperatura. De este modo, se muestrearían unas 25.000 señales por segundo y se generarían unos 160 GB de datos brutos al día sólo de vibraciones.
Ahora imagine una gran refinería con 2.000 activos monitorizados, cada uno equipado con múltiples sensores. El volumen de datos generados y gestionados será enorme. Por eso, la infraestructura de almacenamiento de datos para la monitorización de estado no es una ocurrencia tardía, sino un problema central de la ingeniería de sistemas. Determina directamente qué análisis son posibles, hasta dónde puede llegar la investigación de las causas y cuánto cuesta el funcionamiento del programa.
Debido al enorme volumen de datos, las bases de datos relacionales como PostgreSQL, Oracle y SQL Server no funcionarán. Estas bases de datos se diseñaron para datos transaccionales que se registran con un esquema fijo y un volumen moderado.
Las bases de datos de series temporales están diseñadas específicamente para este tipo de patrón de acceso. Aprovechan la compresión, la optimización de la escritura y la optimización de las consultas por intervalos de tiempo para almacenar y gestionar datos de condiciones a escala.
La contextualización de datos es otra cosa que ayuda a mantener los datos. Es el proceso de vincular los datos de series temporales a los datos maestros de los equipos. Los datos maestros mapean los atributos físicos del activo, como su tipo, ubicación, parámetros de diseño, componentes instalados e historial de mantenimiento. Esta vinculación es lo que permite a un modelo analítico calcular las frecuencias de defectos.
Este es el aspecto de la cadena de contextualización:
| Capa | Sistema | Objeto de datos | Ejemplo |
|---|---|---|---|
| Medición sobre el terreno | Sensor / DCS | Valor bruto de la etiqueta | 4,8 mm/s @ 14:32:07 |
| Historiador | PI / InfluxDB | Etiqueta con marca de tiempo | PMP-223.BRG-DE.VEL.RMS = 4.8 |
| Marco patrimonial | PI AF / GMAO | Enlace etiqueta-activo | La etiqueta pertenece a la Bomba 223, posición del cojinete DE |
| Jefe de equipo | SAP PM / EAM | Registro de equipos | Bomba 223 = Bomba centrífuga, modelo XYZ-300, instalada en 2017 |
| Componente principal | SAP / CMMS LISTA DE MATERIALES | Registro de componentes | Rodamiento DE = SKF 6312, ángulo de contacto 15°, 8 elementos rodantes |
| Historial de mantenimiento | SAP PM / GMAO | Registros de órdenes de trabajo | Último cambio de rodamientos: 2022-03-14, WO 4500123456 |
A pesar de contar con un equipo dedicado a la gestión de bases de datos, almacenar y mantener los datos a esta escala puede resultar complicado. Los sectores con gran volumen de activos pueden solicitar ayuda a proveedores de servicios externos para limpiar los datos maestros, estandarizar y estructurar los nuevos datos, y centralizar todo para que fluya sin problemas desde la capa de sensores hasta la EAM.
Establecimiento de bases estadísticas con análisis
Una vez establecida la infraestructura para transformar y migrar los datos de los sensores al sistema de análisis, la parte de almacenamiento y recuperación está resuelta. Sin embargo, el problema más difícil es determinar las líneas de base o los valores umbral. Las líneas de base influyen en si un programa de monitorización de estado previene fallos o sólo genera inundaciones de alarmas.
Puede establecer las líneas de base en función de las normas de gravedad. Por ejemplo, la norma ISO 10816, ahora consolidada como ISO 20816, establece límites de gravedad absolutos para la velocidad de vibración global RMS. Sin embargo, estas normas tienen limitaciones bien documentadas.
Sólo se aplican a la velocidad de banda ancha RMS, pero no dicen nada sobre el contenido de frecuencia de la vibración. Esto significa que no pueden distinguir entre desequilibrio, defectos en los rodamientos y resonancia. Y todos ellos pueden producir el mismo RMS global pero requerir respuestas de mantenimiento diferentes.
Por ello, muchos equipos de MRO confían en las líneas de base dinámicas en lugar de en el marco del Control Estadístico de Procesos (SPC). En lugar de límites fijos, el SPC crea líneas de base a partir de los propios datos históricos de una máquina. Realiza un seguimiento principalmente de dos parámetros clave:
- Media (μ): Valor medio
- Desviación típica (σ): Variación normal
A partir de ahí, los equipos de mantenimiento pueden calcular líneas de base utilizando μ±3σ. Si las lecturas se salen de este nivel, indica un fallo. De este modo, el SPC reduce las falsas alarmas con estos métodos habituales:
- Gráfico Shewhart: Ayuda a identificar grandes cambios repentinos
- CUSUM: Detecta el desgaste lento y gradual
- EWMA: Este método encuentra pequeños cambios continuos
- Alcance móvil: El rango móvil se utiliza para identificar los aumentos de variabilidad
Para crear líneas de base dinámicas, los ingenieros deben realizar un seguimiento de los índices de salud multiparamétricos. Un solo parámetro no cuenta toda la historia del fallo. En cambio, una visión holística mediante el análisis multiparamétrico ayudará a realizar un análisis eficaz de las causas profundas para evitar que se repitan los mismos fallos.
Integración de EAM/CMMS para cerrar el círculo
La pieza final del flujo de trabajo de monitorización de condiciones es cerrar el bucle que comenzó con la recuperación de los datos de los sensores. Si una persona tiene que supervisar cada alarma y crear órdenes de trabajo para cada una de ellas, el proceso consumirá muchos recursos. También creará fugas que reducirán la eficacia de la supervisión del estado de los activos basada en el estado.
El modelo de monitorización de estado debe integrarse con el sistema de gestión de activos empresariales (EAM). Por ejemplo, SAP PM (Mantenimiento de Planta) es la plataforma EAM dominante en las industrias con uso intensivo de activos. Con el sistema de monitorización de estado como fuente, SAP PM puede automatizarse para un bucle continuo de salud de los activos.
Cada vez que se genera una alerta de estado, el sistema puede enviarla a SAP PM a través de la API REST mediante SAP Integration Suite. Esto creará una notificación SAP PM que captura todos los detalles sobre el activo y el problema relevante. A continuación, el sistema creará automáticamente una orden de trabajo para que los equipos de mantenimiento puedan tomar las medidas necesarias.
| Objeto SAP PM | Finalidad de la integración | Activado por | Campos clave |
|---|---|---|---|
| Notificación PM (M2) | Alerta de estado de grabación | Evento de Condition Monitoring | Localización funcional, descripción del fallo, prioridad |
| Pedido PM | Planificar y autorizar los trabajos de mantenimiento | Revisión del planificador / autocreación | Puesto de trabajo, tareas planificadas, componentes de la lista de materiales, fechas |
| Documento de medición | Almacenar lecturas de condiciones en SAP | Sincronización periódica de datos de condiciones | Punto de medición, valor de lectura, marca de tiempo |
| Mantenimiento | Vincular la lista de tareas al equipo para tareas de condición recurrentes | Configuración inicial | Equipo, hoja de ruta, contador |
| Registro de equipos | Maestro de equipos con datos técnicos | Configuración inicial / sincronización continua | Clase de equipo, fabricante, componentes instalados |
Los equipos de MRR también pueden utilizar IBM Maximo u otros sistemas de GMAO para este fin.
De este modo, la monitorización del estado también ayuda a crear un horizonte planificado para el mantenimiento de las piezas de repuesto. Digamos que un modelo de degradación de rodamientos prevé un fallo a 3-6 semanas vista con una confianza razonable. En este caso, los equipos de compras y mantenimiento pueden trabajar juntos para tener listas las piezas de repuesto incluso antes de que se cree la orden de trabajo.
La cadena de integración para esta capacidad conecta la plataforma de monitorización de estado con el sistema de gestión de inventario MRO, como MRO360 de Verdantis.
Este bucle cerrado es la manifestación operativa del mantenimiento predictivo. Convierte una evaluación de la salud técnica en una acción de la cadena de suministro sin intervención manual en cada paso. Sin embargo, unos datos maestros de equipos deficientes, como números de pieza erróneos en la lista de materiales o vínculos no mantenidos entre los registros de equipos y los maestros de materiales, pueden romper por completo esta cadena.
Supervisión automatizada de las condiciones
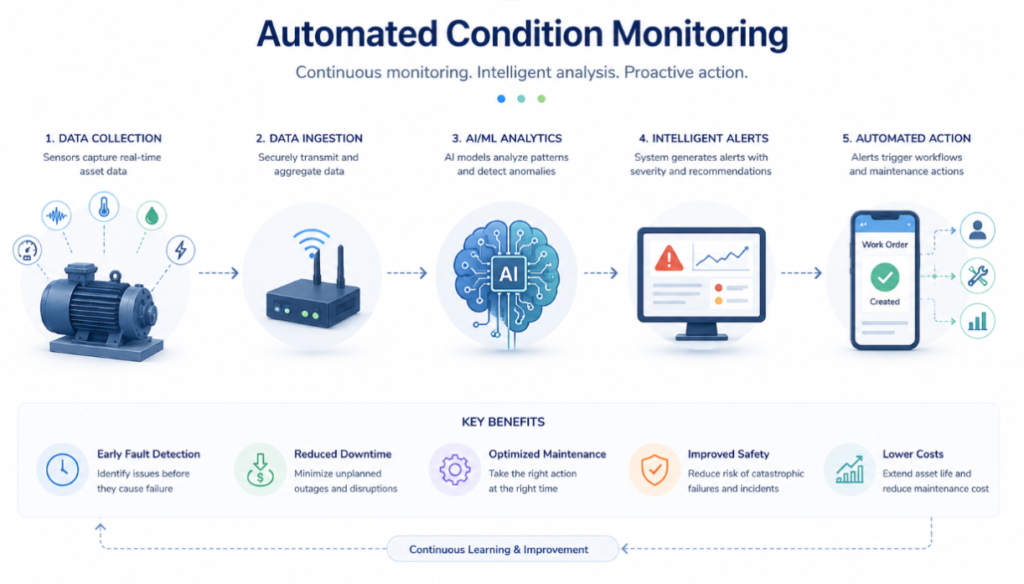
Hay muchas cosas que un sistema de monitorización de estado realiza para detectar el estado de los activos. Pero estas tareas sólo funcionan cuando se realizan de forma orquestada y continua. De forma aislada, ninguno de los procesos sería de gran ayuda.
Por eso, los modernos sistemas de monitorización basados en la condición aprovechan la automatización basada en la inteligencia artificial. Recopilan datos de sensores, los evalúan, identifican fallos en desarrollo y activan acciones de mantenimiento sin necesidad de que un ingeniero humano revise manualmente cada flujo de datos cada día.
Existen diferentes formas en las que la inteligencia artificial (IA) puede ayudar no sólo a capturar y almacenar datos, sino también a analizarlos para encontrar anomalías en los patrones.
Detección no supervisada de anomalías
La detección no supervisada de anomalías es una forma de hacerlo. En este caso, los datos utilizados para entrenar el sistema de control no están etiquetados.
Los autocodificadores son arquitecturas de redes neuronales formadas por un codificador y un decodificador. Tras ser entrenadas con datos operativos sanos y deficientes, estas redes pueden detectar patrones en las señales de los sensores en tiempo real. Si las señales superan algún umbral, los autocodificadores las utilizan para activar una alarma automática.
Del mismo modo, existe el algoritmo de bosque aislado, que utiliza la detección de anomalías basada en árboles y una máquina de vectores de soporte de una clase (OCSVM). Todos ellos son modelos de IA no supervisados que pueden utilizarse en la monitorización automática de condiciones.
| Modelo | Datos de formación necesarios | Interpretabilidad | Escalabilidad | Ajuste de la sensibilidad |
|---|---|---|---|---|
| Autocodificador | Sólo datos sobre equipos sanitarios | Bajo (dentro del espacio latente) | Moderado | Umbral de error de reconstrucción |
| Autocodificador conv. | Sólo datos sobre equipos sanitarios | Bajo | Moderado | Umbral de error de reconstrucción |
| Bosque aislado | Aquí los datos pueden proceder de equipos sanitarios o mixtos | Moderado | Alta | Parámetro de contaminación |
| OCSVM | Sólo datos sobre equipos sanitarios | Bajo-moderado | Bajo (O(n²)) | Parámetro ν |
| Basado en PCA | Sólo datos sobre equipos sanitarios | Alta | Muy alta | Umbral SPE / T² |
| Autocodificador LSTM | Sólo datos sobre equipos sanitarios | Bajo | Moderado | Error de reconstrucción de la secuencia |
Clasificación supervisada de averías
La clasificación supervisada de fallos se realiza utilizando datos de entrenamiento etiquetados. Esto puede ser más preciso si se dispone de datos etiquetados específicos para condiciones de funcionamiento tanto buenas como malas. Por eso es esencial disponer de datos maestros de mantenimiento estructurados para que este tipo de modelos de IA funcionen en los sistemas automatizados de monitorización de estado.
Existen tres modelos principales supervisados que se utilizan en todos los sectores:
- Bosque aleatorio: Un bosque aleatorio entrena un conjunto de árboles de decisión en subconjuntos aleatorios de datos de entrenamiento y espacio de características. A continuación, agrega sus predicciones por votación. Basándose en este entrenamiento, Random Forest puede emitir puntuaciones de importancia. Estas puntuaciones son los indicadores más predictivos para cada tipo de fallo.
- Máquinas de vectores soporte (SVM): Las SVM funcionan especialmente bien con conjuntos de datos etiquetados pequeños. Esto es particularmente cierto cuando el número de características es grande en relación con el número de muestras de entrenamiento, lo que es común en la monitorización de condiciones.
- Redes neuronales convolucionales (CNN): Estas redes neuronales se utilizan para generar imágenes a partir de las señales de los sensores. También pueden cotejar estas imágenes con datos de referencia para identificar anomalías. Un estudio de ScienceDirect describe un marco de monitorización del estado que integra datos de vibración en tiempo real con CNN para permitir la detección automática de fallos y el mantenimiento predictivo. El sistema entrenado detecta y clasifica con precisión fallos en el sistema físico. Esto demuestra una gran fiabilidad y generalización.
Predicción de la vida útil restante (RUL)
La IA puede predecir cuánto tiempo puede seguir siendo útil un activo antes de que se produzca un fallo temporal o una avería completa. La predicción de RUL requiere modelar una trayectoria de degradación desde el estado de salud actual hasta el fallo. Esta trayectoria puede ser muy incierta porque puede cambiar de una máquina a otra.
Con su análisis de supervivencia Weibull, sus modelos de riesgos proporcionales y sus redes de memoria a largo plazo (LSTM), la IA puede ayudar a trazar esta trayectoria con precisión.
Condition Monitoring e IIoT
Además de la inteligencia artificial, el Internet industrial de las cosas (IIoT) es una tecnología esencial para la supervisión automatizada basada en el estado. De hecho, todos los sensores utilizados para recopilar y compartir datos de los equipos ya forman parte del IoT.
El uso de ambos en tándem permite una transferencia de datos sin fisuras a través de sistemas integrados. Con la IIoT, todos los activos pueden volverse inteligentes e interconectarse. Pueden compartir datos entre sí a través de plataformas basadas en la nube para ofrecer una visión central y completa a los equipos de MRR.
Además, IIoT también permite controlar las máquinas a distancia. Así, si una herramienta va camino de fallar rápidamente, los equipos de mantenimiento deben apagarla a distancia para evitar problemas de seguridad y una avería completa de la máquina.
Cómo crear un programa de Condition Monitoring
Un programa de monitorización de estado empieza por evaluar qué activos hay que seguir. En algún momento, querrá abarcar tantas máquinas como sea posible. Sin embargo, es mejor empezar poco a poco y escalar de forma eficiente, en lugar de intentar una implantación a lo grande y fracasar.
Una vez que sepa qué equipos debe supervisar, proceda del siguiente modo:
Instalar los sensores
Una vez que sepa qué activos debe supervisar, determinará también qué constantes vitales debe seguir. A partir de ahí, lo primero que debe hacer es seleccionar los sensores capaces de medir los parámetros necesarios. Además de la selección, concéntrese en determinar la ubicación de los sensores para una captura precisa de las señales.
Recopilar datos
La siguiente tarea consiste en recopilar datos. Lo primero que hay que hacer es recopilar datos de las máquinas que funcionan en condiciones óptimas. Esto ayudará a establecer líneas de base o puntos de referencia para realizar referencias cruzadas durante la supervisión basada en el estado.
Cuando disponga de los datos de referencia, configúrelos para recopilar datos de forma continua o a intervalos regulares. Aquí es importante garantizar la coherencia, ya que las lagunas en los datos pueden reducir la precisión del análisis.
| Proceso | ¿Qué ocurre? | Por qué es importante |
|---|---|---|
| Adquisición de datos | Los sensores instalados en las máquinas e integrados en los sistemas de control del estado enviarán señales sin procesar. | Esto es importante para tener una visión continua de la salud del activo |
| Sincronización horaria | El sistema alinea los datos de múltiples sensores y activos | Permite el análisis multiparamétrico para obtener una visión holística |
| Validación de datos | Filtra el ruido y las lecturas erróneas | Ayuda a evitar falsas alertas que pueden suponer una pérdida de tiempo y recursos. |
| Almacenamiento | Almacena datos en tiempo real en el backend para su análisis y uso futuro. | Admite el bucle de retroalimentación, las tendencias históricas y la modelización. |
Crear una curva P-F
El intervalo de tiempo entre el punto de fallo funcional (F) y el punto en el que un posible fallo se hace detectable (P) se representa mediante la curva P-F. Dado que especifica con cuánta antelación puede detectarse un defecto y de cuánto tiempo se dispone para tomar medidas, es una idea fundamental en la supervisión basada en el estado.
Este concepto se inició en los años 70 para United Airlines y el Departamento de Defensa de Estados Unidos. Para ser eficaz, la supervisión basada en el estado debe producirse durante el intervalo de tiempo entre el fallo potencial y el previsto.
Supervisar los activos
Una vez implantado el sistema, empiece a realizar una supervisión basada en el estado. A partir de los datos recopilados, pueden activarse puntos de referencia. En función de ellos, el sistema puede avisar a los equipos pertinentes y emitir órdenes de trabajo.
Impacto empresarial del Condition Monitoring
La monitorización de las condiciones repercute directamente en los resultados de una empresa.
- Reducción del tiempo de inactividad: El tiempo de inactividad es una de las consecuencias más caras de los fallos de los equipos. La monitorización de estado minimiza la probabilidad de que esto ocurra al detectar a tiempo posibles problemas en las máquinas.
- Mejores resultados en la planificación del mantenimiento: En lugar de suposiciones, las órdenes de trabajo se activan a partir de datos de referencia que revelan anomalías en las condiciones óptimas de trabajo.
- Aumento de la vida útil de los activos: A medida que los equipos de MRR se centran en la salud de los activos en lugar de en calendarios fijos, aumenta la vida útil de la máquina.
- Mayor seguridad: A Artículo del Deccan Herald informa de que cinco personas sufrieron quemaduras a causa del vapor en la planta siderúrgica de SAIL en Bokaro. Son muchos los incidentes de este tipo en los que un fallo de una máquina o un sistema provoca lesiones, y la supervisión del estado puede evitarlos.
- Costes minimizados: Las pérdidas de producción, las reparaciones de urgencia, la agilización de las piezas de recambio, las indemnizaciones a los trabajadores por lesiones, etc., son otros tantos costes que pueden minimizarse.
Aunque la monitorización de estado puede ofrecer todas estas ventajas, los resultados dependen de cómo las empresas recopilen y almacenen los datos de las máquinas. Puede asociarse con proveedores externos de servicios de gestión de datos si carece de experiencia interna.
A gran empresa de producción de madera que opera en 25 plantas, lo consiguió trabajando con Verdantis. Con unos ingresos de $7 mil millones y una plantilla global que supera los 13.000 empleados, la empresa buscó ayuda para la limpieza y la gobernanza de datos.
Verdantis ayudó a estandarizar y gestionar más de 300.000 SKU. También implantó Verdantis Harmony para la gobernanza de datos automatizada en el futuro.
Visión general del Condition-Based Monitoring en la práctica
Con la ayuda de los sensores y los criterios de referencia, los sistemas automatizados pueden activar alertas. Pero lo que parece una simple alerta en un cuadro de mandos es el resultado de múltiples capas de ingeniería de datos, procesamiento de señales y lógica de decisión que trabajan juntas en segundo plano.
En pocas palabras, los sistemas de monitorización basados en la condición funcionan como un bucle cerrado. Los datos se capturan, se procesan, se analizan y, a continuación, se introducen en los flujos de trabajo de mantenimiento. Por tanto, el rendimiento depende de lo bien que estén configuradas e integradas estas capas.
Consideremos una línea de envasado de alta velocidad en una planta de fabricación con múltiples motores, transportadores y cajas de engranajes. En este caso, uno de los activos más críticos es el sistema de accionamiento de la cinta transportadora. Se trata de un motor eléctrico conectado a una caja de engranajes y un conjunto de correas que accionan este sistema. Incluso un simple fallo aquí puede detener toda la línea.
En una instalación tradicional, el equipo de mantenimiento tiene un calendario fijo para inspeccionar toda la correa y la caja de cambios. Pero entre estas inspecciones, el sistema funciona sin control. Así, si un rodamiento de la caja de cambios empieza a degradarse justo después de una inspección, pasará desapercibido hasta la siguiente inspección o hasta que se produzca un fallo.
Por el contrario, supongamos que hay sensores de vibración montados en el motor y la caja de cambios. Del mismo modo, hay sensores de temperatura en los rodamientos, sensores de calidad del aceite en el sistema de lubricación de la caja de cambios y sensores de electricidad que controlan la carga del motor. En este caso, los datos se introducirán continuamente en los sistemas de supervisión. El equipo de mantenimiento verá el nivel de gravedad, el tipo de avería probable y la acción recomendada.
| Escenario | ¿Qué ocurre? | Ejemplo del sistema transportador |
|---|---|---|
| Captura de datos | Los sensores recogerán señales en tiempo real | La amplitud de las vibraciones aumenta ligeramente en la caja de cambios |
| Tratamiento de señales | Aquí, el sistema filtrará el ruido y estabilizará las señales | El ruido de fondo de la señal de vibración se eliminará para una mejor comprensión |
| Extracción de características | Se calculan los indicadores clave | La vibración RMS podría aumentar |
| Comparación de referencia | Comparación entre los datos en tiempo real recogidos por los sensores y el perfil normal | Desviación detectada del patrón de vibración estándar de la caja de cambios |
| Correlación | Se evalúan varios parámetros a la vez | Un ejemplo puede ser un ligero aumento de la temperatura junto con un aumento de las vibraciones |
| Detección de anomalías | El sistema marca cualquier comportamiento anormal detectado en este punto | El análisis puede apuntar a un desgaste prematuro de los rodamientos |
| Generación de alertas | La mayoría de las herramientas modernas disponen de una función de alerta automática que envía una notificación al equipo de mantenimiento. | Se activará una alerta en el cuadro de mandos |
| Creación de órdenes de trabajo | El equipo de mantenimiento emitirá una orden de trabajo para la reparación o inspección. | Inspección programada en función de la gravedad y la urgencia |
¿Para quién es el Condition Monitoring?
La monitorización de estado ofrece los mejores resultados en industrias con muchos activos, como:
Industria pesada
Las instalaciones de fabricación pesada dependen de grandes máquinas interconectadas, como molinos, cintas transportadoras y equipos giratorios. Incluso las pequeñas plantas de fabricación han avanzado hasta utilizar algunas máquinas para automatizar completamente o ayudar con el trabajo manual. Por lo tanto, los activos son esenciales en la industria manufacturera para una producción continua.
La monitorización de las condiciones realiza un seguimiento de las vibraciones, el aceite, la temperatura, etc. en todos estos sistemas. Esto ayuda a detectar con antelación problemas que más tarde podrían provocar fallos y detener la producción.
Alimentación y bebidas
A diferencia de otras industrias, en el sector de la alimentación y las bebidas la fiabilidad de los equipos también está ligada a la calidad del producto y al cumplimiento de las normas. Mezcladoras, bombas, unidades de refrigeración y sistemas de envasado deben cumplir estrictas normas de higiene y funcionar de forma óptima. Una forma de garantizarlo es controlar si los equipos funcionan dentro de los parámetros definidos, y la monitorización de estado puede ayudar a conseguirlo.
Petróleo y gas
Los equipos de la industria del petróleo y el gas corren el mayor riesgo de avería debido a las condiciones de funcionamiento. Compresores, turbinas, tuberías y máquinas de perforación operan en condiciones remotas y peligrosas. Ni siquiera es posible que los equipos de mantenimiento inspeccionen regularmente estas herramientas cuando están en funcionamiento.
La monitorización del estado proporciona una visibilidad continua del estado de los activos sin necesidad de inspecciones físicas constantes. Dado que muchos activos funcionan en condiciones extremas, la detección precoz es fundamental en este sector.
Generación de energía
Los activos clave de la industria de generación de energía incluyen turbinas, generadores, transformadores y sistemas de refrigeración. El análisis de vibraciones detecta fallos en turbinas y generadores, mientras que la supervisión térmica identifica el sobrecalentamiento de los componentes eléctricos. La supervisión continua garantiza que incluso las desviaciones menores se detecten a tiempo.
Rentabilidad de la implantación de Condition Monitoring
Calcular la rentabilidad de la implantación de la monitorización de estado no consiste simplemente en calcular los costes frente a los ahorros. Debería centrarse más en el valor que aporta el proceso. La mayoría de las empresas no calculan el verdadero ROI por centrarse demasiado en el ahorro en mantenimiento. Además, también hay que tener en cuenta la reducción del tiempo de inactividad, la mejora de la salud de los activos, el aumento de la capacidad de producción, etc.
Debe empezar con un modelo de referencia que incluya el coste del tiempo de inactividad, la frecuencia de fallos, la mano de obra de mantenimiento y los problemas de calidad. A continuación, puede convertir las métricas técnicas en resultados financieros.
Este es el aspecto de la cadena de contextualización:
| Métrica técnica | Traducción financiera |
|---|---|
| Reducción del fracaso | Esto aumentará el tiempo de actividad y la capacidad de producción |
| Detección precoz de fallos | La detección precoz evita fallos catastróficos y los consiguientes costes de reparación o sustitución. |
| Mejor planificación del mantenimiento | Reduce las horas extraordinarias y los costes de mantenimiento de emergencia |
| Mejora de la salud de los activos | Esto ahorra dinero al aumentar la longevidad de los activos. |
Otro aspecto importante a tener en cuenta aquí es que el ROI aumenta con la escala y la madurez. Con el tiempo, su monitorización de estado puede ofrecer un ROI de 5:1 o 10:1, escalando a 25:1 en un plazo de tres a cinco años. Aunque se trata de un rango aproximado, el ROI real podría diferir en función de la eficacia con la que implante y aproveche la monitorización del estado.
El problema de la Fundación de Datos y su solución
Limitarse a colocar sensores en los activos y obtener datos en tiempo real no dará los mejores resultados de la supervisión de estado. Aunque la mayor parte de la planificación se realiza con datos en tiempo real, también es necesario estructurarlos y estandarizarlos para su almacenamiento y uso futuro.
Por ejemplo, supongamos que una solución de monitorización basada en condiciones ha detectado una anomalía en las vibraciones. Sin embargo, el sistema no puede determinar qué rodamiento activó la alerta porque en la lista de materiales del equipo figura un número de pieza incorrecto. Esto sólo contribuirá a aumentar las redundancias en lugar de ayudar a prevenir fallos en los equipos.
La tecnología de sensores, los algoritmos de procesamiento de señales, los modelos ML y las canalizaciones OPC-UA son necesarios, pero se construyen sobre una base de datos precisa.
Uno de los problemas más generalizados es el carácter incompleto de los datos maestros de los equipos. En la práctica, los registros maestros de equipos en SAP PM y sistemas EAM equivalentes pueden llevar campos de atributos incompletos. Del mismo modo, la duplicación de piezas de repuesto MRO, las imprecisiones de la lista de materiales y las incoherencias en los datos entre sitios pueden afectar a la calidad de los datos e influir en los resultados de la supervisión basada en el estado.
Verdantis puede ayudar a resolver estos retos con sus soluciones basadas en años de experiencia y excelencia. Verdantis Harmonize, por ejemplo, puede resolver el problema de la limpieza de datos históricos.
La plataforma basada en la nube ingiere registros de datos maestros heredados de SAP, Oracle, IBM Maximo y otros sistemas ERP/EAM. A continuación, aplica una combinación de procesamiento basado en IA y revisión humana experta para estandarizar, enriquecer, deduplicar y clasificar esos registros según una taxonomía predefinida.
Mientras que Verdantis Harmonize resuelve el problema de los datos históricos, Verdantis Integrity resuelve el problema de la gobernanza continua. Integrity funciona como una capa de gobernanza integrada con sus sistemas ERP y EAM. Cuando se va a crear un nuevo registro de material en SAP, intercepta la solicitud de creación y aplica un flujo de trabajo de validación antes de que el registro se escriba en el ERP.
Todo esto se reúne en nuestra plataforma MRO360. Su suite MDM incluye Harmonize e Integrity para obtener datos limpios y precisos. Esto permite a los equipos de MRO aprovechar una base de datos limpia para la supervisión basada en el estado que impulsa la toma de decisiones operativas informadas.
Conclusión
La monitorización de condiciones es una de las disciplinas técnicamente más exigentes de las operaciones industriales. Aunque tiene mucho que ofrecer, también requiere competencias que abarcan la ciencia de la medición física, el procesamiento de señales de alta frecuencia, el modelado estadístico, el aprendizaje automático, las redes industriales, la infraestructura de datos y la integración de sistemas empresariales.
Muy pocas organizaciones tienen todas estas capacidades reunidas en un solo lugar. Y son aún menos las que las tienen montadas sobre una base de datos lo suficientemente limpia como para permitir un rendimiento óptimo.
Ése es el problema de infraestructura que Verdantis lleva dos décadas resolviendo para organizaciones con un uso intensivo de activos. Los programas de monitorización de estado basados en datos maestros limpios, gobernados y enriquecidos superan sistemáticamente a los que no lo están.
Conéctese con nuestros expertos para comprender cómo Verdantis puede ayudarle a crear una base de datos de referencia para implementar soluciones de supervisión de estado.
Preguntas más frecuentes (FAQ)
¿Cuáles son los 5 elementos del Condition Monitoring?
Los cinco elementos clave del Condition Monitoring son la recopilación de datos, el análisis de datos, la generación de alertas, la planificación del mantenimiento y la mejora continua. Juntos, estos elementos permiten un enfoque proactivo de la supervisión continua del estado de una máquina para un funcionamiento óptimo.
¿Cuál es la diferencia entre PdM y CBM?
Tanto el mantenimiento predictivo (PdM) como la monitorización basada en la condición (CDM) son enfoques de mantenimiento proactivo. Sin embargo, difieren en el tiempo y la tecnología. El PdM recopila datos de sensores y predice fallos analizándolos. Por otro lado, el CDM se centra en la comparación de datos en tiempo real con un umbral establecido para detectar cuándo una máquina o pieza de equipo está por debajo de su estado óptimo.
¿Cuáles son los 5 tipos de vigilancia?
En mantenimiento, reparación y operaciones, los tipos comunes de técnicas de monitorización incluyen vibración, temperatura, presión, aceite y monitorización ultrasónica. Sin embargo, hay muchos otros aspectos de un activo que los equipos de MRO pueden monitorizar.