

MRO-Bestandsverwaltung in der Öl- und Gasindustrie ist kein Detail in der Bilanz. Es ist die Grenze zwischen einem produzierenden Bohrloch und einem täglichen Verlust in Höhe von mehreren Millionen Dollar und die Disziplin, die darüber entscheidet, ob Ölfelder, Raffinerien und Lagerstätten ihre Zahlen erreichen.
Eine einzige Offshore-Produktionsplattform kann die $500.000 bis über $1 Million pro Tag wenn ein kritisches Teil nicht vor Ort verfügbar ist. Eine Raffinerie, die wegen einer fehlenden Ventilbaugruppe vier Tage lang nicht arbeiten kann, kostet $25-50 Millionen an entgangener Gewinnspanne. Und die unproduktive Zeit (NPT) auf den Bohrinseln, bei der sich allein die Kosten für die Streuung je nach Bohrinselklasse auf $80.000 bis $1 Million pro Tag belaufen, beträgt nach Schätzungen der Branche mehr als 30%, die auf Ausrüstungs- und Teileprobleme zurückzuführen sind.
Und doch sitzen dieselben Unternehmen, die durch Fehlbestände Geld verlieren, gleichzeitig auf Lagern voller toter Bestände. Umfragen in der Branche beziffern den Anteil inaktiver MRO-Bestände regelmäßig auf 20-35% des gesamten Ersatzteilwertswobei einige anlagenintensive Betreiber sogar noch höhere Zahlen feststellen, wenn ein echtes Audit durchgeführt wird.
Dies ist das zentrale Paradoxon der Bestandsverwaltung in der Öl- und Gasindustrie: gleichzeitige Über- und Unterbestände, oft innerhalb desselben Geschäftsbereichs und häufig auch innerhalb desselben Lagers.
In diesem Leitfaden wird aufgeschlüsselt, was die Bestandsverwaltung in der Öl- und Gasindustrie tatsächlich beinhaltet - die vollständige Taxonomie der Bestandskategorien, Lagerhaltungsstrategien für Upstream-, Midstream- und Downstream-Standorte, die strukturellen Herausforderungen, die die MRO in der Öl- und Gasindustrie schwieriger machen als in jeder anderen Schwerindustrie, der End-to-End-Prozess, die wichtigen KPIs, die Software für die Bestandsverwaltung und wie ein moderner, KI-nativer Ansatz in der Praxis aussieht.
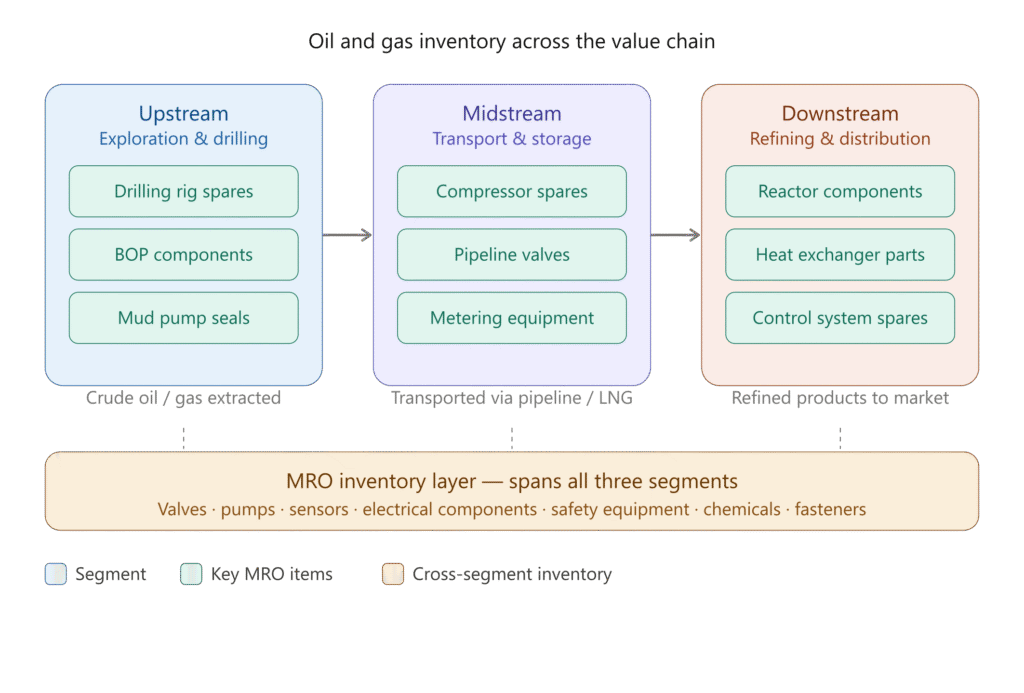
Von vorgelagerten Bohrstellen bis hin zu Raffinerien, Terminals und Pipelines umfasst das Inventar in der Öl- und Gasindustrie MRO-Ersatzteile, Investitionsgüter, Kohlenwasserstoffe, Bohrchemikalien, OCTG-Rohre und überschüssiges Material, die alle unterschiedlichen Regeln, Eigentümern und Risikoprofilen unterliegen.
In diesem Leitfaden erfahren Sie, was die Bestandsverwaltung in der Öl- und Gasindustrie tatsächlich umfasst: die Kategorien, Lagerhaltungsstrategien, MRO-Disziplin, buchhalterische Behandlung, KPIs, Kriterien für die Softwareauswahl und wie ein KI-nativer Ansatz in der Praxis aussieht.
Was ist Öl- und Gasbestandsmanagement?
Die Verwaltung von Öl- und Gasbeständen ist der Prozess der Verfolgen, Organisieren, Kontrollieren und Optimieren alle Materialien, Ersatzteile, Ausrüstungen, Verbrauchsmaterialien und Verbrauchsgüter, die im gesamten Öl- und Gasgeschäft verwendet werden - von vorgelagerten Bohrstellen bis hin zu Raffinerien und nachgelagerten Vertriebseinrichtungen.
Es gewährleistet die die richtigen Materialien am richtigen Ort, zur richtigen Zeit und in der richtigen Menge verfügbar sindund minimieren gleichzeitig überschüssige Bestände, doppelte Bestände und betriebliche Ausfallzeiten.
Was umfasst das O&G-Inventar?
Das typische Inventar eines Öl- und Gasunternehmens umfasst ein breites Spektrum an physischen Materialien, die jeweils einen eigenen Lebenszyklus, ein eigenes Eigentumsmodell und ein eigenes Risikoprofil haben:
-
- MRO-Ersatzteile (Wartung, Reparatur und Betrieb) für Bohrausrüstungen, Raffinerie-Ventilsysteme, Gaskompressionsanlagen, Motoren und Hydrauliksysteme - Lager, Ventile, Dichtungen, Befestigungselemente, elektrische und instrumentelle Komponenten
- Rohre, Ventile, Fittings, Flansche und OCTG-Rohre (Verrohrung, Rohrleitungen, Bohrgestänge)
- Pumpen, Motoren, Kompressoren, Turbinen - die rotierende Ausrüstung, die die Nachfrage nach MRO-Dienstleistungen auf dem Markt für Öl- und Gasausrüstung antreibt
- Onshore- und Offshore-Bohrausrüstung, Unterwassersysteme und Bohrinselkomponenten
- Komponenten für Lagertanks für Erdölprodukte - schwimmende Dachabdichtungen, Dampfrückgewinnung, Mischer
- Sicherheitsausrüstung und PSA: Feuerlöscher, Gasdetektoren, Notfallkoffer
- Chemikalien und Schmiermittel: Bohrschlämme, Fertigstellungschemikalien, Korrosionsinhibitoren
- Teile des Abfallmanagementsystems: Filter, Membranen, Einbauten für Abscheider
- Verbrauchsmaterial und Lagerbedarf: Schweißdrähte, Reinigungschemikalien, Verpackungen
Zwei Wochen Bearbeitungszeit, keine Verpflichtung.
Stakeholder: Wem gehört eigentlich das Inventar?
Involvierte Abteilungen
Einkauf von Materialien, Verhandlungen mit Lieferanten, Vertragsmanagement
Lagerung, Verwaltung von Ausgaben, Cycle Counting, physische Verwahrung
Ersatzteilplanung, Verbrauch von Arbeitsaufträgen, Zuverlässigkeitsentscheidungen
Bedarfserzeugung, Produktionsplanung, Verbrauch
Bilanzierung von Öl- und Gasvorräten, Bewertung von Vorräten, Analyse der Buchführungskosten, Verwaltung des Betriebskapitals, Abschreibungen
Technische Spezifikationen, Stücklistendefinition, OEM-Beziehungen
End-to-End-Koordination, Logistik, Vorlaufzeitmanagement
Systemintegration, Datenfluss, technische Unterstützung
Materialstammqualität, MDM-Standards, Taxonomien
Einhaltung von Sicherheitsvorschriften, Gefahrgut, PSA-Management
Interne Stakeholder
Wartungsteams - Anlagenbetrieb - Beschaffung - Leitung der Lieferkette - Lagerteams - Zuverlässigkeitstechnik - Finanzen - IT & ERP-Teams - HSE-Teams.
Externe Stakeholder
Lieferanten - OEMs - Drittanbieter von Logistikdienstleistungen - Auftragnehmer - Auditoren - Aufsichtsbehörden (z.B. BSEE, HSE-UK, NOPSEMA je nach Rechtsprechung).
Rollen in der Lieferkette
Strategische Beschaffungsmanager - Category Manager - Einkäufer - Inventarverwalter - Lagerverwalter - Materialkoordinatoren - Wartungsplaner - Zuverlässigkeitsingenieure - Stillstandsplaner - Logistikkoordinatoren - Stammdatenanalysten - MDM-Spezialisten - Kostenkontrolleure.
Warum Inventarisierung in der Öl- und Gasindustrie so wichtig ist
Der Öl- und Gasbetrieb ist sehr anlagenintensiv und Ausfallzeiten sind extrem teuer. Schlechte Bestandsverwaltung führt direkt dazu:
- Produktionsstillstände und aufgeschobene Produktion
- Verzögerte Wartungsaktivitäten und längere MTTR
- Notfallbeschaffung zu Höchstpreisen (oft das 5-10fache der Standardtarife)
- Überbevorratung und gebundenes Betriebskapital
- Duplizieren von Materialien in verschiedenen Werken und Standorten
- Anhäufung und Abschreibung veralteter Bestände
- Risiken für die Sicherheit und die Einhaltung von Vorschriften
Wenn beispielsweise in einer Raffinerie eine kritische Pumpendichtung oder ein kritisches Ventil während eines Ausfalls nicht verfügbar ist, können sich die Produktionsausfälle auf Millionen pro Tag - und die Kosten für die Notfallbeschaffung sind nur ein Bruchteil der verlorenen Gewinnspanne.
Der Bestand an Öl und Gas ist untrennbar mit der Management der Gerätewartung - Jeder Arbeitsauftrag erzeugt ein Ersatzteilbedarfssignal, und jeder Lagerausfall verzögert einen Wartungsauftrag.
Bevor wir uns mit den Einzelheiten befassen, ist es wichtig zu wissen, dass "Vorräte" in der Öl- und Gasbranche nicht aus einem Guss sind. Es handelt sich um drei sehr unterschiedliche Hauptkategorien - jede mit ihrer eigenen Physik, ihrer eigenen buchhalterischen Behandlung und ihrer eigenen Managementdisziplin.
Die wahren Kosten einer schlechten Bestandsverwaltung
Bevor wir uns mit den besten Praktiken befassen, lohnt es sich, zu beziffern, was eine schlechte Bestandsverwaltung tatsächlich kostet. Die Zahlen sprechen unbestreitbar für eine Investition in diese Funktion.
~$500K
Die Kosten für eine Stunde ungeplanter Ausfallzeit in der Öl- und Gasindustrie haben sich zwischen 2019 und 2022 im Einklang mit den steigenden Ölpreisen mehr als verdoppelt
$149M
Durchschnittlicher jährlicher Verlust pro O&G-Anlage bei Höchststand der Ölpreise 2022. Schlechteste Ergebnisse übersteigen selbst unter Standardbedingungen $88M
36%
Verringerung ungeplanter Ausfallzeiten durch datengesteuerte gegenüber reaktiven Wartungsstrategien
Ungeplante Ausfallzeiten sind die sichtbarsten Kosten, aber sie sind nicht die einzigen. Überbevorratung, der entgegengesetzte Ausfallmodus, vernichtet stillschweigend Werte, indem er Betriebskapital in langsam umlaufenden oder veraltete Teile.
Untersuchungen zeigen immer wieder, dass 10-20% der Materialstammsätze in großen Öl- und Gasunternehmen doppelt vorhanden sind, was zu redundanter Beschaffung und überschüssigem Bestand führt.
Ein Öl- und Gasexplorations- und -produktionsunternehmen verwendete eine pauschale Min-Max-Bestandskontrollpolitik für alle über 4.200 Ersatzteile in seinem MRO-Lager, unabhängig vom Wert oder der Wichtigkeit der Teile. Das Ergebnis waren hohe Lagerkosten für Artikel mit geringer Priorität und eine unzureichende Abdeckung der Teile, die tatsächlich wichtig sind.
Die Forscher wendeten die ABC-Klassifikation an, um den Bestand zu segmentieren: nur 7% Teile machten 74% des gesamten Inventarwertes aus. Die Umstellung von hochwertigen A-Artikeln auf ein Modell der kontinuierlichen Überprüfung (Q, r) ermöglichte es dem Unternehmen, die Investitionen in den Lagerbestand zu reduzieren und gleichzeitig die Servicequalität zu verbessern. Quelle: Verbessertes MRO-Bestandsverwaltungssystem in einem Öl- und Gasunternehmen, MDPI
Bewerten Sie sich selbst auf dem Spare Parts Maturity Index.
Ein Benchmark-Score über 6 Dimensionen: Kritikalität, Bedarfsplanung, Stockout-Risiko, Datenqualität, Veralterung & Lieferantenzuverlässigkeit und vorausschauende Wartung. Sie erhalten einen detaillierten Bericht mit Lücken und Abhilfemaßnahmen
Die drei Hauptkategorien des Öl- und Gasinventars
Die drei Säulen der Öl- und Gasinventur
Indirekte Materialien (MRO)
Ersatzteile und Verbrauchsmaterialien, die Produktionsanlagen am Laufen halten - Ventile, Pumpen, Dichtungen, Bohrer, Schmiermittel, Chemikalien. Die größte Herausforderung bei der Lagerhaltung in der Öl- und Gasindustrie.
Kapital Materialien
Rohre, Verrohrungen, Bohrgestänge, schwere Maschinen, die für Raffinerieerweiterungen oder neue Bohrungen bereitgestellt werden. Die Klassifizierung der Investitionsausgaben ist unterschiedlich, aber die operative Handhabung entspricht der von MRO.
Kohlenwasserstoff-Inventare
Das Produkt selbst - Rohöl, Gas, NGLs - wird in Mengen über Tanks, Pipelines und Terminals verfolgt. Das ist sehr technisch, unterliegt den API/ISO-Standards und ist mit vielen Abstimmungsproblemen verbunden.
1. Indirektes Inventar (MRO)
Dies sind die Ersatzteile und Verbrauchsmaterialien, die die Produktionsanlagen am Laufen halten. Sie müssen in der richtigen Menge, am richtigen Ort und zur richtigen Zeit verfügbar sein - oder die Produktion steht still.
Beispiele: Lager, Ventile, Sicherheitsausrüstung, elektrische Ersatzteile, Dichtungen, Befestigungselemente, Pumpen, Motoren, Schmiermittel, Bohrschlämme, Fertigstellungschemikalien, Bohrspülungen, Korrosionsschutzmittel, Demulgatoren, Handwerkzeuge, PSA.
Dies ist die größte Herausforderung bei der Inventarisierung im Öl- und Gasgeschäft - und das zentrale Thema dieses Artikels.
2. Kapitalinventar
Dabei handelt es sich um hochwertige strategische Ersatzteile und große Infrastrukturkomponenten - Turbinen, Kompressoren, OEM-Baugruppen, Röhrengüter (OCTG), Pipelines, Bohrgestänge, Verrohrungen, Rohre, große Transformatoren, schweres Gerät, das für neue Bohrstellen oder Raffinerieerweiterungen bereitgestellt wird.
Futterrohre, Schläuche und Bohrgestänge werden beim Bau der Anlage selbst verbraucht. Wenn ein Bohrloch gebohrt wird, werden kilometerlange Rohre dauerhaft in den Boden zementiert. Sie sind physisches Inventar bis zu dem Moment, in dem sie installiert werden - ab diesem Zeitpunkt werden sie Teil des Bohrlochs und nicht Teil des Lagerraums.
Obwohl es sich bei diesen Artikeln um physische Materialien handelt, werden sie durch ihre Klassifizierung als Investitionsausgaben (CapEx) in der Regel von den indirekten MRO-Kategorien in der Finanzberichterstattung ausgeschlossen. Die steuerliche Behandlung, die Abschreibungspläne und die Projektbuchhaltung unterliegen einem anderen System.
Aber operativ? Lagerräume verwalten sie ähnlich wie MRO: Lagerhaltung, Vorlaufzeitdruck, Lieferantenbeziehungen und das Risiko von Fehlbeständen verhalten sich alle auf dieselbe Weise. In diesem Artikel werden wir die Kategorien 1 und 2 unter dem Begriff "indirekte Materialien" zusammenfassen.
Praktische OCTG-Bestandsverwaltung bedeutet, dass jede Rohrlänge mit einer eindeutigen Werksnummer, Güteklasse und Verbindungsart versehen ist und dass der Überblick über die Rohrlager der Betreiber und Auftragnehmer gewahrt bleibt, so dass derselbe Strang nicht zweimal bestellt wird.
3. Kohlenwasserstoff-Inventar
Dies ist das umsatzbringende Produkt selbst Rohöl, Diesel, LNG, Flüssiggas und Flaschengas, Heizöl, Schmierstoffe in loser Schüttung, Kraftstoffvorräte in Einzelhandels- und Versandnetzen, Düsentreibstoff, NGLs, Kondensate und raffinierte Produkte.
Die Verwaltung von Kohlenwasserstoffbeständen ist eine ganz andere Disziplin. Sie ist sehr technisch, unterliegt den API- und ISO-Messstandards und ist voller struktureller Herausforderungen: Die Einheitlichkeit der Produkte ist selten garantiert, die Messungen sind mit Ungenauigkeiten behaftet, der physikalische Zustand ändert sich ständig und die gesetzlichen und steuerlichen Anforderungen sind unmittelbar. Wir werden dies später im Detail behandeln.
Zu den Teildisziplinen innerhalb dieser Kategorie gehören die Verwaltung von Flüssiggasbeständen (Kombination von Großdrucklagern mit Mehrwegflaschenflotten), die Verwaltung von Heizölbeständen in Depots und Kundentanks, die Verwaltung von Kraftstoffbeständen und -versand für Mineralölhändler sowie die Zuordnung von Kohlenwasserstoffen zu den produzierenden Bohrlöchern und Flüssen.
Der Mindestbetriebsbestand an Öl - die Untergrenze, unter der eine Raffinerie oder ein Terminal nicht betrieben werden kann - befindet sich innerhalb dieser Regelung.
Die vollständige Taxonomie: 15 Kategorien des Öl- und Gasinventars
In der Praxis entwickeln sich die drei oben genannten Säulen zu einer viel umfangreicheren Taxonomie. Ein ausgereifter Betreiber verfolgt in der Regel fünfzehn verschiedene Bestandskategorien, jede mit ihrer eigenen Planungsmethode, MRO-Beschaffungsstrategie, Lagerkontrollen, finanzielle Behandlung und Risikoprofil.
Das Verständnis, zu welcher Kategorie ein bestimmter Artikel gehört, bestimmt, wie er verwaltet wird. Ein Verbrauchsschmierstoff und ein Turbinenrotor können und sollten nicht nach denselben Regeln verwaltet werden.
15 Kategorien, sortiert nach Funktion
Lager, Ventile, Fangvorrichtungen, elektrische Ersatzteile.
Turbinen, Kompressoren, OEM-Baugruppen, große Transformatoren.
Rohöl, Diesel, LNG, Flugzeugtreibstoff, NGLs.
Bohrchemikalien, Katalysatoren, Prozessadditive, Produktionschemikalien - werden direkt in der Produktion verbraucht.
Handschuhe, Schweißdrähte, Schmiermittel, Batterien, Reinigungsmittel. Von Natur aus schnelllebig.
Kompressordichtungen, kritische Pumpenbaugruppen, Turbinenschaufeln. Verwaltet über die Analyse der Kritikalität von Anlagen.
Bohrrohre, Feldausrüstung, Bohrinselzubehör, Produktionsrohre. Hauptsächlich flussaufwärts.
Zusätzliche Lagerbestände, um Nachfrageunsicherheiten, Lieferverzögerungen und operative Risiken zu bewältigen.
Alte Gerätemodelle, abgelaufene Chemikalien, veraltete Ersatzteile. Ein großes finanzielles Problem.
Shutdown-Kits, provisorische Ausrüstung, große Wartungsersatzteile für geplante Ausfälle.
Materialien, die zwischen Lieferanten, Lagerhäusern, Plattformen und Werken bewegt werden. Verfolgt von Logistik-Teams.
Inventar für den Bau von Anlagen, Erweiterungsprojekte, EPC-Projekte. Baumaterialien und projektspezifische Ausrüstung.
Bestände, die sich im Besitz von Lieferanten befinden oder von diesen beim Kunden aufgefüllt werden. Üblich für Verbindungselemente, PSA, Verbrauchsmaterial.
Wird vor Ort gelagert, gehört aber bis zum Verbrauch dem Lieferanten. Hilft, das Betriebskapital zu reduzieren.
Paletten, Verpackungsmaterial, Gabelstaplerbatterien - zur Unterstützung der Lager- und Betriebsabläufe selbst.
Es gibt so viele Kategorien, weil der Öl- und Gasbetrieb sehr anlagenintensiv, sicherheitskritisch, geografisch verteilt und bei Ausfallzeiten extrem kostspielig ist.
Jede MRO-Kategorie-Management erfordert unterschiedliche Planungsmethoden, Beschaffungsstrategien, Lagerkontrollen, finanzielle Behandlung, Risikomanagement und Optimierungsmodelle.
Sie alle mit einem Satz von Regeln zu behandeln, was bei vielen Betreibern immer noch der Fall ist, ist genau das, was das Paradoxon der gleichzeitigen Überbevorratung und Auslagerung hervorruft.
Mehrdimensionale Klassifizierung
Die 15 Kategorien sagen Ihnen, was ein Artikel ist. In der Praxis wird jeder Artikel jedoch gleichzeitig in mehreren Dimensionen klassifiziert und diese Klassifizierungen bestimmen, wie der Artikel geplant, beschafft, gelagert und verwaltet wird.
Sechs Dimensionen, nach denen jede SKU klassifiziert wird
Eine einzelne kritische Pumpendichtung könnte sein: Indirekt - Kritisch - Langsam drehend - A-Klasse Wert - Alternd - Langlebig. Jede Dimension steuert unterschiedliche Kontrollen.
Nach Verwendung
Nach operativer Kritikalität
Durch Bewegung
Nach Wert (ABC)
Nach Lebenszyklus
Nach Lieferrisiko
Beispiel: Das Innere eines einzelnen Raffinerie-Lagers
Um all dies zu verdeutlichen: Hier ein Ausschnitt dessen, was ein einzelnes Raffinerielager an einem bestimmten Tag enthalten könnte, und zwar in den Kategorien, die wir gerade definiert haben.
Ein Schnappschuss:Bestandsmix in einem typischen Raffinerielager
Kategorie | Beispiel Artikel |
Kohlenwasserstoff | Lagerung von Diesel in Produkttanks |
Indirekt / MRO | Lager für Einheitspumpen |
Kapital | Turbinenrotor für Generalüberholung vorbereitet |
Verbrauchsmaterial | Versorgung mit Schmierstoffen und Fetten |
Shutdown-Inventar | Kits für Umschaltventile |
Sicherheitsvorrat | Gleitringdichtungen für den Notfall |
Veraltet | Ältere Pumpenersatzteile aus stillgelegten Anlagen |
Projekt-Inventar | Baumaterialien für das Erweiterungsprojekt |
Ein Lagerhaus. Acht verschiedene Kategorien. Acht verschiedene Regelwerke für Beschaffung, Lagerung, finanzielle Behandlung und Entsorgung.
Das ist das Ausmaß an Komplexität, das selbst ein einzelner Standort zu bewältigen hat. Multiplizieren Sie das mit der Flotte eines Betreibers von Anlagen, Terminals, Plattformen und Bohrinseln, und die Herausforderung beginnt, sich zu konzentrieren.
Warum die MRO-Bestandsaufnahme in der Öl- und Gasindustrie so einzigartig schwierig ist
Die meisten Schwerindustrien haben mit MRO-Beständen zu tun. Keiner hat es mit Öl und Gas zu tun. Fünf strukturelle Herausforderungen brechen die klassische Inventartheorie.
1. Ungewöhnlich lange Vorlaufzeiten.
Ein Teil, das in 48 Stunden in einem Werk im Mittleren Westen ankommt, kann 6-14 Wochen um eine Nordseeplattform zu erreichen und 40-52 Wochen für kundenspezifische Artikel mit langen Lieferzeiten wie Spezialventile oder Unterwasser-Kontrollmodule. Die Logistikkette (Seefracht, Versorgungsschiffe, Wetterfenster, Verfügbarkeit von Hubschraubern) macht Bestellpunkte aus dem Lehrbuch bedeutungslos.
Die Durchlaufzeit in der Öl- und Gasbestandsverwaltung muss dynamisch verfolgt werden - nach Standort, nach Teil und nach Lieferant. Es kann sich nicht um ein statisches Feld im ERP handeln, das seit drei Jahren nicht mehr aktualisiert wurde.
2. Die technische Natur der Teile.
Unterwasser-Weihnachtsbäume, BOPs, Gaskompressions-Zylinderpacks, Einbauten in Raffinerieventilen und Schlammpumpen sind keine Allgemeingüter. Die meisten von ihnen sind Einzelanfertigungen, geschützt und nicht austauschbar. Deshalb ist der MRO-Markt für Öl- und Gasanlagen strukturell in die Anlageklassen Bohrung, Raffination, Gasverarbeitung, Unterwasser und Lagerung aufgeteilt.
Das dadurch entstehende Datenproblem ist gravierend: Bei einem typischen Betreiber mit mehr als 20 Anlagen ist ein einziges Teil (ein 2-Zoll-Kugelhahn, ANSI 600, WCB-Gehäuse) routinemäßig als 5-15 verschiedene SKUs mit inkonsistenten Beschreibungen, fehlenden Attributen, verwaisten Stücklistenverknüpfungen und veralteten Einträgen, die noch aktiv sind. Stammdatenqualität ist die Voraussetzung für alles andere.
3. Moderne Industrie, veraltete Inventarisierungspraktiken.
Dieselben Betreiber, die digitale Zwillinge auf milliardenschweren Anlagen betreiben, verwalten MRO mit Excel und regelbasierten ERP-Modulen von vor zwei Jahrzehnten.
Minimal- und Maximalwerte werden nicht überprüft, die Bewertung der Kritikalität wird alle paar Quartale in Offline-Workshops vorgenommen, und die Sichtbarkeit zwischen den Werken ist schlecht. Speziell entwickelte KI wie die von Verdantis MRO360 schließt jetzt diese Lücke, ohne das ERP zu zerreißen und zu ersetzen.
4. Das Paradoxon von Über- und Unterbeständen.
Operatoren gleichzeitig:
- Halten Sie 20-35% Totes Lager - Teile inaktiv 5+ Jahre
- Der Vorrat an kritischen Verbrauchsgütern geht zur Neige, so dass eine Notlieferung per Luftfracht zu 5-10x Standardkosten
- Halten Sie nahezu doppelte Reserven in verschiedenen Werken vor, die sich gegenseitig nicht kennen.
- Sicherheitsbestände tragen, die auf Annahmen beruhen, die nicht mehr der Realität entsprechen
Beide Enden des Paradoxons haben dieselbe Wurzel: Die Lagerbestände sind nicht auf die tatsächliche Kritikalität und die Verbrauchsmuster abgestimmt. Eine Reduzierung des MRO-Betriebskapitals um 15-25% ist ein realistisches Ziel, das für jeden großen Betreiber Hunderte von Millionen freisetzt.
5. Kritikalitätseinschätzungen, die nicht der Realität entsprechen.
FMECA, VED und ABC sind gültige Rahmenwerke. Das Problem ist die Anwendung:
- Kritikalität auf Asset-Ebene im Großhandel auf Teile abgebildet wird - aber ein nicht kritischer Kompressor mit einem 40-Wochen-Siegel aus einer einzigen Quelle ist in der Praxis kritisch.
- Es handelt sich um eine einmalige Übung, nicht um einen kontinuierlichen Prozess - Bewertungen sind zu dem Zeitpunkt, an dem sie veröffentlicht werden, bereits veraltet.
- Es integriert keine echten operativen Daten - Ausfallraten, Zuverlässigkeit der Lieferanten, Arbeitsauftragspipelines, Stücklistenstrukturen.
Genau diese Lücke schließt MRO360 mit 25+ ERP-, EAM- und CMMS-Datenpunkten, einem ML-Scoring-Modell, das auf branchenspezifische Fehlermodi und Substituierbarkeit trainiert ist, schriftlichen Begründungen für jede Bewertung und menschlichen Überschreibungen, die Fachwissen auf Werksebene in globales institutionelles Wissen verwandeln.
6. Planung von Turnaround & Shutdown (TAR) Inventar
Ein Anlagenstillstand (TAR) ist eine geplante, regelmäßige Abschaltung der gesamten oder eines Teils einer Öl- und Gasanlage zur umfassenden Inspektion, Wartung und Aufrüstung.
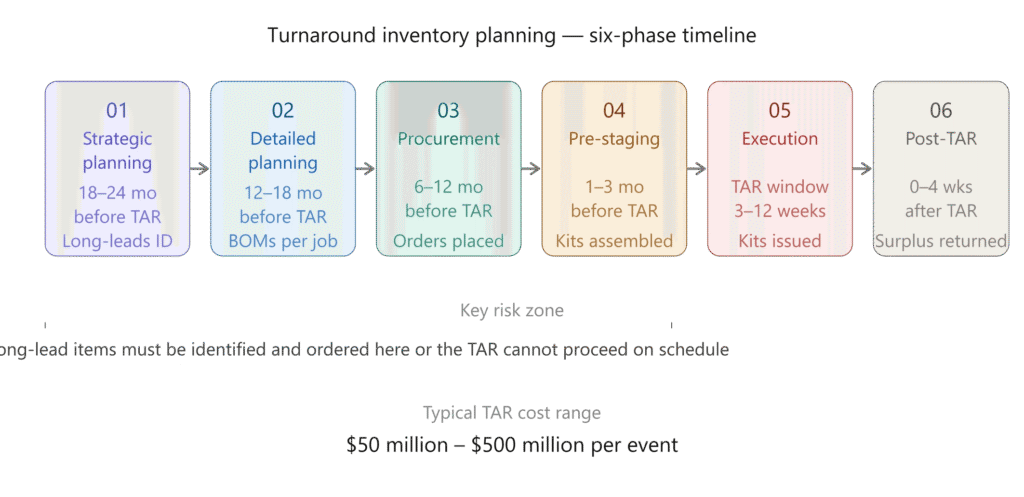
Turnarounds finden alle 3-5 Jahre und gehören zu den komplexesten und teuersten Ereignissen in der Branche, die oft $50M-$500M kosten und deren Durchführung 3-12 Wochen dauert. (Quelle: Öl & Gas IQ: Stilllegungen und Turnarounds)
Während des normalen Betriebs wird der Bestand für eine gleichbleibende Nachfrage verwaltet. Während einer TAR steigt die Nachfrage gleichzeitig auf Hunderte von Arbeitsaufträgen an.
Jede Schraube, jede Dichtung, jedes Ventil und jedes Spezialwerkzeug muss vor Ort sein, bevor die Anlage vom Netz geht, denn wenn die Uhr erst einmal zu laufen beginnt, bleibt keine Zeit mehr, auf Lieferungen zu warten.
TAR-spezifische Überlegungen zur Bestandsaufnahme
- Pre-Kitting: Zusammenstellen und Bereitstellen aller Materialien für bestimmte Arbeitspakete vor Beginn der Abschaltung, so dass die Wartungsteams ein komplettes Set abholen können, anstatt nach einzelnen Teilen zu suchen
- Langfristig angelegte Artikel: Spezialventile, große Ersatzteile für rotierende Maschinen oder kundenspezifisch gefertigte Teile können eine Vorlaufzeit von 12 bis 52 Wochen haben, was eine Identifizierung und Bestellung 12-18 Monate vor dem TAR erfordert.
- Überschuss-Management: Nach dem TAR müssen unbenutzte bereitgestellte Materialien zurückgegeben, wieder aufgefüllt oder neu klassifiziert werden, ein Prozess, der für eine effiziente Ausführung saubere Materialdaten erfordert.
- Materialverantwortung des Auftragnehmers: TARs bringen Tausende von Drittanbietern mit sich, deren Materialverbrauch für bestimmte Arbeitsaufträge nachverfolgt werden muss.
Zeitplan für die TAR-Planung
Phase | Zeitleiste vor TAR | Wichtige Inventarisierungsaktivitäten |
Strategische Planung | 18-24 Monate | Definieren Sie den Umfang, identifizieren Sie langwierige Aufgaben, aktualisieren Sie die Kritikalitätsbewertungen |
Detaillierte Planung | 12-18 Monate | Entwickeln Sie Arbeitspakete, erstellen Sie Materialstücklisten pro Auftrag, erteilen Sie Aufträge mit langen Lieferzeiten. |
Beschaffung | 6-12 Monate | Bestellen Sie Standardmaterialien, bestätigen Sie die Lieferzeiten der Lieferanten, prüfen Sie die erhaltenen Waren |
Pre-Staging | 1-3 Monate | Ausstatten von Materialien nach Arbeitspaket, Stufe in vorher zugewiesenen Lagerzonen |
Ausführung | Während TAR | Ausgabe von Kits an Arbeitsteams, Verfolgung des Verbrauchs in Echtzeit, Verwaltung von Überschüssen |
Post-TAR | 0-4 Wochen danach | Rückgabe von Überschüssen, Aktualisierung des Materialstamms, Abgleich von Stücklisten-Istwerten mit dem Plan. |
Shell begann 2007 mit der Planung der Umstellung des Athabasca-Ölsandprojekts, drei Jahre vor dem Hinrichtungsfenster 2010. An der Veranstaltung waren über 4.500 Auftragnehmer beteiligt, mehr als 250 neue Ventilinstallationen und ein Materialprogramm im Wert von mehreren Millionen Dollar, das über mehrere Beschaffungswellen verwaltet wurde.
Das Projekt wurde pünktlich und innerhalb des Budgets abgeschlossen. Das wichtigste Unterscheidungsmerkmal: die frühzeitige Identifizierung von Spezialmaterialien mit langen Lieferzeiten, mehrjährige Rahmenverträge mit Lieferanten und integrierte digitale Planungssysteme, die Stücklisten für Arbeitsaufträge direkt mit der Beschaffung und Lagerhaltung verknüpften.
Die Lektion ist klar: Der Erfolg der TAR-Inventarisierung wird Jahre vor Beginn der Abschaltung bestimmt, nicht in den letzten Wochen. Quelle: Öl & Gas IQ
Verdantis MRO360 hilft Betreibern der Öl- und Gasindustrie, ihre MRO-Bestände um 15-25% zu reduzieren und gleichzeitig kritische Ersatzteilbestände zu vermeiden - ohne Ihr bestehendes ERP oder EAM zu ersetzen. Die meisten Implementierungen zeigen messbare Einsparungen innerhalb eines Quartals.
Live-Demo anfordernDie sieben Kernfunktionen der Bestandsverwaltung
Eine effektive Inventur ist keine einzelne Aktivität - sie ist eine Disziplin, die aus sieben miteinander verbundenen Funktionen besteht. Eine Schwäche in einer dieser Funktionen beeinträchtigt das gesamte System.
Inventarverfolgung
Überwachung von Lagerbeständen, Standorten, Bewegungen und Nutzung in Echtzeit in Lagern, auf Offshore-Plattformen, in Terminals und Werken. Die Grundlage, von der alles andere abhängt.
Ersatzteilmanagement
Sicherstellen, dass kritische Ersatzteile für die Wartung der Ausrüstung und für Turnaround-Aktivitäten verfügbar sind - mit dem richtigen Gleichgewicht zwischen Verfügbarkeit und Transportkosten.
Verwaltung von Materialstammdaten
Standardisierung von Artikelbeschreibungen, Klassifizierungen, Maßeinheiten und Spezifikationen, um Duplikate zu vermeiden und die Genauigkeit der Beschaffung zu verbessern. Die Voraussetzung für jede andere Funktion. Dies ist genau der Punkt, an dem Verdantis Harmonisieren arbeitet.
Aktien-Optimierung
Ausgleich von Bestandsverfügbarkeit und Lagerkosten durch Identifizierung von Überbeständen, Langsamdrehern, toten Beständen und kritischen Materialien - und entsprechende Anpassung der Bestelllogik.
Beschaffung & Nachschub
Automatisieren Sie die Bestellpunkte und stellen Sie den rechtzeitigen Einkauf von Materialien sicher - mit einer dynamischen Verfolgung der Vorlaufzeiten und einer in die Logik integrierten Zuverlässigkeit der Lieferanten.
Lagerverwaltung
Die Lagerhaltungsstrategien in der Öl- und Gasindustrie umfassen zentralisierte Hub-and-Spoke-Modelle, dezentralisierte Lager an den Standorten, von Lieferanten verwaltete Bestände und Konsignation sowie gepoolte Lagerhaltung durch mehrere Betreiber.
Innerhalb des Lagers: Lagerorte, Lagerplatzverfolgung, Wareneingang, Warenausgabe, Zykluszählung und Gefahrguttrennung gemäß OSHA PSM, ATEX und IECEx. Die physische Ebene, die alles andere unterstützt und einer der größten Hebel für die Effizienz des Betriebskapitals ist.
Kritikalitätsanalyse
Priorisierung des Inventars auf der Grundlage von Betriebsrisiko, Wichtigkeit der Ausrüstung, Vorlaufzeit, Ersetzbarkeit und Folgen eines Ausfalls. Hier ist das KI-gestützte Scoring den klassischen Workshop-Methoden wirklich überlegen.
Der End-to-End-Prozess der Bestandsverwaltung
Auf Prozessebene läuft die Bestandsverwaltung als ein geschlossener Kreislauf von zehn Schritten ab, von dem Moment, in dem ein Materialbedarf festgestellt wird, bis hin zu den Analysen, die den nächsten Optimierungszyklus speisen. Jeder Schritt hat sein eigenes Aufzeichnungssystem, seinen eigenen Besitzer und seine eigenen Fehlermöglichkeiten.
Identifizierung der Nachfrage
Der Bedarf an Materialien wird durch Wartungspläne, Stillstandspläne, Produktionsanforderungen oder Notausfälle ausgelöst. Moderne Systeme nehmen auch Bedarfssignale aus der vorausschauenden Wartung und IIoT-Daten auf.
Validierung des Materialstamms
Der Artikel wird im ERP-System geprüft, um eine doppelte Erstellung, falsche Spezifikationen oder falsche Maßeinheiten zu vermeiden. In der Regel wird dies über MDM-Plattformen wie Verdantis Integrität, SAP MDM oder SAP Master Data Governance, oder IBM InfoSphere MDM.
Inventarprüfung
Das Lager prüft den aktuellen Bestand, den reservierten Bestand, den Sicherheitsbestand und bestehende Bestellungen - idealerweise mit werksübergreifender Sichtbarkeit, um werksübergreifende Umlagerungsmöglichkeiten zu erkennen, bevor ein neuer Kauf ausgelöst wird.
Beschaffungsprozess
Wenn kein Lagerbestand verfügbar ist, wird eine Anfrage gestellt, ein Lieferant ausgewählt und eine Bestellung erstellt - normalerweise in Systemen wie SAP S/4HANA oder Oracle ERP Cloud.
Wareneingang & Inspektion
Die Materialien werden inspiziert, qualitätsgeprüft, mit Etiketten oder Barcodes versehen und in den dafür vorgesehenen Lagerbehältern gelagert. Fehler bei der Inspektion lösen hier Verfahren für Nichtkonformität und Rückmeldungen an den Lieferanten aus.
Lagerhaltung & Lagerung
Die Materialien werden nach Lagerungsstrategie (zentraler Hub, Standort, VMI, Konsignation), Gefahrenklassifizierung, Temperaturanforderungen, Kritikalität und Verwendungshäufigkeit organisiert.
Gefährliche Chemikalien, ATEX-zertifizierte Geräte, hochwertige Ersatzteile und sichere Lagerbestände für Teile von Offshore-Bohrinseln erfordern alle unterschiedliche Handhabungssysteme.
Überwachung des Inventars
Kontinuierliche Überwachung von Lagerbeständen, Verbrauchsraten, Haltbarkeitsdauer und Min/Max-Schwellenwerten. Hier übertrifft die KI-gesteuerte Anomalieerkennung die regelbasierten Warnmeldungen.
Materialausgabe und -verwendung
Materialien werden an Wartungsarbeiten, Turnarounds, Bohrungen und Produktionseinheiten ausgegeben, wobei der Verbrauch mit dem ursprünglichen Arbeitsauftrag verrechnet wird.
Zykluszählung & Audits
Regelmäßige physische Überprüfungen gewährleisten die Genauigkeit der Warenwirtschaft, die Kontrolle des Warenschwunds und die Einhaltung von Audits. Die Diskrepanz zwischen Buch- und Warenbestand ist ein wichtiger Indikator für den Zustand der Prozesse.
Optimierung & Berichterstattung
Analysen identifizieren überschüssige Bestände, veraltete Bestände, doppelte Materialien und überbevorratete Kategorien - und speisen den Kreislauf zurück in die Bedarfsprognose und Nachbestellungslogik. Dies ist das Ende des Zyklus und der Beginn des nächsten.
Technologien für die moderne Öl- und Gasinventur
Die richtige Software für die Öl- und Gasinventarisierung ist selten ein einziges Tool, sondern ein Stapel aus vier Schichten, jede mit unterschiedlichen Vor- und Nachteilen.
Betreiber, die ein Bestandsverwaltungssystem, eine Tracking-Lösung oder eine Plattform für die Verwaltung von Öldepots evaluieren, benötigen in der Regel ERP für das transaktionale Rückgrat, EAM/CMMS Software zur Verwaltung von Arbeitsaufträgen für den Anlagen- und Arbeitsauftragskontext, eine MDM-Suite für den Ersatzteilstamm und eine KI-native MRO-Intelligenzschicht darüber.
IBM Maximo, SAP PM, Oracle eAM, Infor EAM - wo jeder Vermögenswert, jede Gerätestückliste und jeder Arbeitsauftrag für die Wartung lebt. MRO-Bestand macht nur Sinn, wenn das EAM den geplanten Verbrauch in Echtzeit an das Lager weitergibt.
SAP Materialwirtschaft-IM und MM-CBP, Oracle ERP Cloud Inventory. Das transaktionale Rückgrat - Materialstämme, Bestandsbilanzen, Reservierungen, Warenbewegungen und Bestellungen. Die Grundlage für alles; allein nicht ausreichend.
Ersetzt statische Min-Max-Modelle durch dynamische Modelle, die aus dem tatsächlichen Verbrauch, den Produktionsplänen, den geplanten Arbeitsaufträgen und den Signalen der vorausschauenden Wartung lernen. Die einzige Möglichkeit, die intermittierende Nachfrage nach Ersatzteilen mit langen Laufzeiten und langsamer Umschlaggeschwindigkeit zu prognostizieren.
Multivariable ML-Bewertung auf SKU-Ebene - Fehlermodi, Lieferantenzuverlässigkeit, Substituierbarkeit, Vorlaufzeit, Sicherheitsfolgen. Ersetzt FMECA / VED-Workshops durch kontinuierliche, datengesteuerte Bewertung. Das ist der Punkt Verdantis MRO360 arbeitet.
Vibrations-, thermische, akustische und SCADA-Telemetrie, die vorhersagt, welche Anlagen kurz vor dem Ausfall stehen - so werden die richtigen Ersatzteile bereitgestellt, bevor ein Lagerausfall zu einem Produktionsstillstand wird. Die Nachfrage wird vorausschauend, nicht reaktiv.
Ohne deduplizierte, klassifizierte, attributreiche Materialstammsätze läuft jede darüber liegende Analyseschicht auf Datenmüll. Verdantis Harmonisieren reinigt alte Ersatzteile; Integrität regelt neue Datensätze an der Quelle mit konfigurierbaren Genehmigungs-Workflows.
KI extrahiert Stücklisten von Anlagen aus OEM-PDFs, Lieferantenkatalogen und technischen Zeichnungen und verknüpft Ersatzteile automatisch mit Geräten und Funktionsstandorten. Ohne sie können Kritikalität und Bedarf nicht mit der tatsächlich installierten Basis verglichen werden.
Etikettierung auf Lagerebene, Handscanner und mobile Materialausgabe. Ohne vertrauenswürdige Genauigkeit bei den physischen Beständen basieren alle Berechnungen von Nachbestellungen und Kritikalitätsbewertungen auf Zahlen, denen die Planer nicht glauben.
Standortübergreifendes Pooling von Lagerbeständen, das Möglichkeiten für werksübergreifende Transfers aufzeigt, bevor ein neuer Kauf ausgelöst wird. Der schnellste Weg, den Wert von toten Lagerbeständen zu verringern - und einer, den die meisten Betreiber heute nicht kennen.
ROP-Berechnung in Echtzeit anhand der aktuellen Vorlaufzeit, des täglichen Verbrauchs und des aktuellen Sicherheitsbestands - und nicht anhand der drei Jahre alten Zahl im ERP-Feld. Entscheidend für Offshore- und abgelegene Standorte, wo die Vorlaufzeiten lang und variabel sind.
Verfolgen Sie die tatsächliche Lieferleistung der Lieferanten nach Teilen, Standorten und Jahreszeiten - und lassen Sie diese Daten in die Bestelllogik und die Bewertung der Kritikalität einfließen. Flaggen von Alleinlieferanten und Hochrisikolieferanten tauchen auf, bevor sie zu Produktionsausfällen werden.
Virtuelle Anlagenrepliken, die Ausfallmodi simulieren, um die genauen Ersatzteile, die jedes Szenario verbraucht, vorab zu validieren. Stücklisten, Turnaround-Kits und Ersatzteilpools werden auf der Grundlage realer Ausfallwahrscheinlichkeiten bemessen - nicht nach der Intuition des Planers.
Diese Schichten ersetzen sich nicht gegenseitig, sie ergänzen sich. Software zur Verwaltung von Ausrüstungsbeständen/CMMS bilden die Grundlage, daneben steht das ERP-Bestandsmodul. Die Datenschicht (MDM, Anlagenstücklisten, Verknüpfung von Teilen mit Geräten) regelt alles darüber. Die Lagerschicht macht die physische Inventur vertrauenswürdig.
Die Beschaffungsebene hält Bestellpunkte und Lieferantendaten aktuell. Und die Intelligenzebene - KI-Prognosen, Kritikalität auf Teilebene, Vorhersagesignale - steuert die Optimierungsschleife.
Verdantis MRO360 fungiert als diese Intelligenzschicht, wobei Harmonize und Integrity die darunter liegende Datenschicht regeln. Der gesamte Stack fügt sich in die EAM- und ERP-Systeme ein, die ein Betreiber bereits einsetzt, und ersetzt diese nicht.
Wie eine KI-native Plattform das Spiel für MRO verändert
MRO-Bestände in der Öl- und Gasindustrie haben ein gemeinsames Grundproblem: Die zugrunde liegenden Daten sind unübersichtlich, fragmentiert und werden von den Planern, die darauf aufbauend Entscheidungen treffen, selten als vertrauenswürdig angesehen. Doppelte Teilesätze. Inkonsistente Beschreibungen in verschiedenen Werken. Veraltete Kritikalitätsbewertungen. Vorlaufzeitfelder, die seit drei Jahren nicht mehr aktualisiert wurden. Anlagenstücklisten, die in OEM-PDFs gefangen sind, die niemand mit dem Lagerraum verknüpft.
Tabellenkalkulationen und regelbasierte ERP-Module können dies nicht in großem Umfang lösen. Statische FMECA-Matrizen, die einmal im Jahr aktualisiert werden, können nicht mit einer globalen Anlagenbasis mithalten, bei der sich Lieferanten, Lieferzeiten und Konfigurationen vierteljährlich ändern. Und generische KI-Tools, die auf Verbraucherdaten trainiert sind, lassen den tiefen technischen Kontext vermissen, den Ersatzteile, Stücklisten und OEM-Kataloge erfordern.
Was funktioniert, ist eine speziell entwickelte, in der Branche geschulte KI, die auf Millionen von Ersatzteilbeschreibungen, Anlagenstücklisten, OEM-Katalogen, Lieferantendatensätzen und Fehlermustern basiert, die für den Öl- und Gasbetrieb spezifisch sind.
Das ist die Designphilosophie hinter den beiden Verdantis-Suiten:
Die EAM-Suite - MRO360
Die Inventar-Intelligenzschicht, die den gesamten MRO-Kreislauf über das bestehende EAM und ERP eines Betreibers laufen lässt - kein Rip-and-Replace erforderlich:
- KI-eigene Kritikalität auf Teilebene - Multivariables ML-Scoring über mehr als 25 ERP-, EAM- und CMMS-Datenpunkte: Ausfallmodi, Vorlaufzeiten, Substituierbarkeit, Alleinlieferantenrisiko, Sicherheitsfolgen
- Dynamische Nachfrageprognose - überlagert statistische Modelle mit agentenbasierter KI, die Produktionsvolumina, geplante und ungeplante Arbeitsaufträge sowie vorausschauende Wartungssignale berücksichtigt
- Bestellpunkt-Optimierung - laufend anhand der aktuellen Durchlaufzeiten und Sicherheitsbestandsziele neu berechnet, nicht anhand der drei Jahre alten Zahl im ERP-Feld
- Integration von Arbeitsaufträgen - Der geplante Verbrauch aus dem EAM fließt direkt in die Nachfrage ein, so dass der Bestand die Arbeit vorwegnimmt, anstatt auf sie zu reagieren
- Vorausschauende, wartungsgesteuerte Bedarfssignalisierung - IIoT- und SCADA-Telemetrie positioniert Ersatzteile im Voraus, bevor ein Ausfall zu einem Stockout wird
- Identifizierung toter Tiere und Übertragung zwischen Pflanzen - zeigt ruhende Bestände an und empfiehlt Transfers, bevor eine neue Bestellung ausgelöst wird
- Parts Intelligence Agent - durchgängig verpackte, kontinuierliche Zuordnung veralteter Teile zu ihren Alternativen, technischen Beschreibungen, Spezifikationen und Substituierbarkeit in der gesamten installierten Basis
Die MDM-Suite - Harmonisieren + Integrität
Die Datengrundlage, auf der MRO360 basiert. Ohne saubere, deduplizierte, attributreiche Materialstammdaten basiert jede darüber liegende Analyseschicht auf Zahlen, denen die Planer nicht trauen.
- Harmonisieren Sie - die patentierte Stammdaten-Normalisierungs-Engine. Standardisieren Sie bestehende Material-, Anlagen-, Lieferanten- und Dienstleistungsstammdaten automatisch. Trainiert auf branchenspezifische Kataloge und Taxonomien (UNSPSC, eClass), mit Auto-Enrich AI für die Extraktion von Attributen aus OEM-Dokumentation und Agentic AI für die Wiederherstellung technischer Spezifikationen aus unstrukturierten PDFs und Katalogen. Identifiziert Duplikate in verschiedenen Werken, verknüpft Ersatzteile mit Anlagenstücklisten und markiert veraltete Datensätze.
- Integrität - die aktive Governance-Ebene, die Stammdatensätze überwacht zum Zeitpunkt der SchöpfungMit konfigurierbaren Genehmigungsworkflows stellen Sie die Vollständigkeit und Korrektheit Ihrer Daten sicher. Kontinuierliche Überwachung der Datenqualität fängt eine Verschlechterung ab, bevor sie sich ausbreitet. Verhindert, dass schlechte Daten überhaupt erst in das ERP-System gelangen, anstatt sie sechs Monate später zu bereinigen.
Warum das funktioniert
Es geht uns nicht darum, KI als Modewort zu verkaufen. Die Modelle funktionieren, weil die darunter liegende Datenschicht richtig aufgebaut ist und ein menschlicher Verstärkungsworkflow dafür sorgt, dass das Fachwissen institutionalisiert und nicht umgangen wird:
- Wenn ein leitender Wartungsplaner einen Kritikalitätswert überschreibt, erfährt MRO360 dies.
- Wenn ein Zuverlässigkeitsingenieur eine Teil-zu-Anlage-Verknüpfung korrigiert, überträgt sich die Korrektur auf alle Werke.
- Wenn ein Lagerteam ein gültiges Ersatzteil für ein veraltetes Teil identifiziert, wird dieses Ersatzteil für alle anderen Standorte verfügbar.
Fachwissen auf Werksebene wird zu globalem, institutionellem Wissen, anstatt in den Ruhestand zu gehen, wenn Einzelpersonen in Rente gehen.
Offshore vs. Onshore-Bestandsmanagement
Die physische Umgebung von Öl- und Gasbetrieben verändert die Bestandsstrategie grundlegend. Offshore-Plattformen und abgelegene Onshore-Standorte sind mit Einschränkungen konfrontiert, die die Standardannahmen für die Lieferkette unanwendbar machen.
|
Faktor |
Offshore (Plattform / FPSO) |
Onshore (Raffinerie / Pipeline) |
|
Weltraum |
Äußerst begrenzt: Jede SKU muss ihre Stellfläche rechtfertigen, da der Platz auf dem Deck knapp ist. |
Relativ flexibel, mit großen Lagerhäusern in der Nähe der Anlage möglich |
|
Vorlaufzeit für die Wiederbeschaffung |
Stunden bis Tage per Hubschrauber oder Versorgungsschiff; wetterabhängig und kostspielig |
Stunden per Straßenfracht; am gleichen Tag oder am nächsten Tag üblich |
|
Stockout Konsequenz |
Möglicherweise wochenlang ohne Ersatzteil, während der Produktionsverlust täglich zunimmt |
In der Regel innerhalb von Stunden mit lokalen Lieferanten lösbar |
|
Halten Sie mehr Versicherungsersatzteile vor Ort, trotz hoher Transportkosten. JIC dominiert hier. |
Schlanke Lagerhaltung für die meisten Artikel möglich; Notfallbeschaffung möglich |
|
|
Inventarverfolgung |
RFID und Barcode unverzichtbar; manuelle Nachverfolgung unter rauen Bedingungen zu fehleranfällig |
Sowohl manuelle als auch automatisierte Ansätze realisierbar |
|
Einhaltung gesetzlicher Vorschriften |
SOLAS, MARPOL, OPRC für Gefahrgut; plattformspezifische Sicherheitsvorschriften |
OSHA PSM, EPA Tier Reporting, lokale Umweltgesetze |
|
Arbeitskräfte |
Spezialisierte Techniker rotieren im 2-4-Wochen-Rhythmus; Wissenskontinuität ist ein Risiko |
Feste lokale Arbeitskräfte mit täglichem Zugang zum Gelände |
Offshore-Betreiber mit der schlechtesten Performance-Erfahrung $88M+ an jährlichen Kosten für Ausfallzeiten per Kimberlite's Studie über den Öl- und Gasmarkt . Ein Großteil davon ist auf die Nichtverfügbarkeit von Teilen zurückzuführen, ein Problem, das im Moment des Ausfalls nicht gelöst werden kann, sondern nur durch eine proaktive Bestandsplanung Monate im Voraus.
Buchhaltung und Bewertung von Öl- und Gasvorräten
Das Inventar in der Öl- und Gasindustrie wird nicht in einer einzigen Zeile des Hauptbuchs ausgewiesen. Er ist auf drei Buchhaltungssysteme aufgeteilt, die von den Finanz-, Betriebs- und Zuverlässigkeitsteams unterschiedlich behandelt werden:
- MRO und Verbrauchsmaterial - werden als Betriebskosten behandelt, sobald sie einem Arbeitsauftrag zugewiesen werden, aber in der Bilanz aktiviert, solange sie sich im Lagerraum befinden. Die Buchhaltungskosten betragen in der Regel18-25% des Inventarwertes pro Jahr wenn Sie Kapital, Lagerung, Versicherung, Veralterungsabschreibungen und Schwund berücksichtigen.
- Investitionsgüter und Rohre (OCTG) - werden als Projektinventar gehalten, bis sie installiert werden, und dann als Anlagevermögen kapitalisiert und abgeschrieben. Futterrohre und Schläuche werden in dem Moment, in dem sie ins Bohrloch gebracht werden, vom Inventar zum Anlagevermögen.
- Kohlenwasserstoff-Inventar - werden nach steuerlichen und buchhalterischen Regeln bewertet, die je nach Land und Produkt variieren. Rohöl, das in Tanklagern gelagert wird, wird in der Regel nach dem Niederstwertprinzip (LCNRV) bewertet. Raffinerieprodukte werden je nach den Rechnungslegungsgrundsätzen des Betreibers nach dem FIFO-Prinzip, dem gewichteten Durchschnitt oder der spezifischen Identifizierung bewertet.
Das Problem des Abgleichs ist real. Die Kohlenwasserstoffmengen, die durch Tanks, Pipelines, Abscheider und Zähler fließen, sind auf dem Papier nie gleich Null - Messunsicherheit, Temperatur-/Druckkorrekturen, Verdunstung und Messtoleranzen führen zu nicht erfassten Produkten, die gemäß den Regeln für die Zuteilung von Kohlenwasserstoffen den Strömen wieder zugeordnet werden müssen. Die meisten Betreiber tolerieren eine Allokationslücke von 0,5-1,5%; alles, was darüber hinausgeht, löst ein Audit aus.
Die Senkung der Lagerkosten, die Eliminierung von Abschreibungen und die saubere Zuordnung von Kohlenwasserstoffen haben alle eine gemeinsame Voraussetzung: vertrauenswürdige Stammdaten. Lager, Ventile, Zähler und Tanks müssen sich in jedem Werk in einen einzigen Datensatz auflösen lassen, bevor eine buchhalterische Betrachtung des Bestands vertretbar ist.
Die Vorteile einer richtigen Inventarisierung
Der finanzielle und betriebliche Nutzen einer guten Bestandsverwaltung in der Öl- und Gasindustrie ist erheblich und messbar. Betreiber, die von reaktivem zu modernem Bestandsmanagement übergehen, erzielen durchweg Ergebnisse in acht Dimensionen:
In den meisten Öl- und Gasunternehmen ist die Bestandsverwaltung eng verbunden mit Vermögensverwaltung bei Öl und GasWartungsplanung, Lieferkettenbetrieb, Stammdatenmanagement, Zuverlässigkeitstechnik und Turnaround-/Stillstandsplanung. Die Verbesserung eines einzelnen dieser Bereiche ohne die anderen ist der falsche Ansatz. Behandeln Sie die Inventarisierung als Bindegewebe, und die Gewinne setzen sich zusammen.
Best Practices für die MRO-Bestandsverwaltung in der Öl- und Gasindustrie
Wie sieht angesichts der oben genannten Herausforderungen und der strukturellen Komplexität ein leistungsstarker Ansatz eigentlich aus?
Die folgende Abfolge ist das, was in der Praxis bei Betreibern funktioniert, die von reaktiven zu wirklich modernen Inventarisierungsmaßnahmen übergegangen sind.
Normalisieren Sie zunächst die Ersatzteil-Stammdaten
Alle nachgelagerten MRO-Analysen - Kritikalität, Prognosen, Bestellpunkte, Analyse der MRO-Ausgaben, Kategorie-Strategien für das gesamte Öl- und Gas-Ersatzteilportfolio - läuft über den Ersatzteilstamm. Deduplizieren, klassifizieren und erweitern Sie alte Datensätze. Standardisieren Sie Beschreibungen nach Taxonomie (UNSPSC, eClass), extrahieren Sie technische Attribute aus der OEM-Dokumentation, identifizieren Sie doppelte SKUs in verschiedenen Werken und verknüpfen Sie Ersatzteile über Stücklisten mit Anlagen. Dies ist genau das, was Verdantis Harmonisieren automatisiert in großem Umfang, mit Integrität für jeden neuen Datensatz bei der Erstellung.
Führen Sie die Kritikalität auf der Teileebene aus, nicht auf der Asset-Ebene
Ein nicht kritischer Kompressor kann eine Dichtung aus einer Hand mit einer Vorlaufzeit von 40 Wochen enthalten - diese Dichtung ist kritisch, unabhängig vom Einstufung und Bewertung von Vermögenswerten. Wiederherstellung der Kritikalität an der SKU-Ebene unter Verwendung von: dynamischer Vorlaufzeit, Zuverlässigkeit der Lieferanten und Risiko der Konzentration auf eine einzige Quelle, Substituierbarkeit, Fehlerfolgen (Produktion, Sicherheit, Umwelt), historische Fehlerquote, Kosten und Veralterungsrisiko. MRO360 bewertet Teile kontinuierlich, nicht in jährlichen Workshops.
Dynamische Prognose des Ersatzteilbedarfs
Statische Min-Max-Werte sind der stille Feind der MRO. Die Nachfrage nach Ersatzteilen ist schwankend und unregelmäßig - klassische Zeitreihenmodelle versagen hier. Moderne Prognosen kombinieren historischen Verbrauch, Änderungen des Produktionsvolumens, geplante und ungeplante Arbeitsaufträge, Signale für die vorausschauende Wartung aus dem IIoT und branchenübliche OEM-Fehlermodelle, um eine verlässliche Nachfrage im Long Tail zu erzeugen.
Machen Sie die Vorlaufzeit zu einer erstklassigen Variable bei den Bestellpunkten
Die Formel - Meldebestand = (Durchschnittlicher Tagesverbrauch × Vorlaufzeit) + Sicherheitsbestand - ist korrekt. Das Problem ist, dass die Betreiber mit veralteten Vorlaufzeiten und statischen Sicherheitsbeständen arbeiten. In der Öl- und Gasindustrie ist die Vorlaufzeit ein bewegliches Ziel, je nach Teil, Standort und Jahreszeit. Verfolgen Sie sie dynamisch. Berechnen Sie die Bestellpunkte für wichtige Ersatzteile wöchentlich neu - nicht einmal im Jahr für alles.
Aktivieren Sie tote Bestände und aktivieren Sie werksübergreifende Transfers
Die 20-35% an MRO-Beständen, die als tote Bestände herumliegen, sind kein verlorener Wert - sie sind gesperrt Wert. Sobald der Wert werksübergreifend sichtbar ist, gibt es verschiedene Möglichkeiten: Transfer zwischen den Werken, bevor eine neue Bestellung ausgelöst wird, Rückgabe an den Lieferanten zur Gutschrift, Liquidation des Restwerts, Inzahlungnahme durch den OEM, Neuzuordnung zu aktiven Stücklisten. Die meisten Betreiber lassen einen 7-stelligen Wert in den Lagerregalen liegen, weil sie nicht sehen können, was sie haben.
Die gleiche Logik gilt für das Management von überschüssigem Öl- und Gasmaterial - überschüssige OCTG aus abgeschlossenen Bohrungen, überschüssiges Turnaround-Material, Altöl und Altölbestände, die auf Recycling warten. Standardisierte Spezifikationsdaten verwandeln Überschüsse von einer Abschreibung in eine werthaltige werksübergreifende oder basinweite Reklassifizierung.
Integrieren Sie die EAM Work-Order Pipeline mit dem Inventar
Wartungsaufträge verbrauchen Teile. Das Inventar muss diesen Verbrauch vorhersehen, nicht darauf reagieren. Eine moderne MRO-Plattform ist direkt mit dem EAM und dem CMMS integriert. Sie bezieht geplante und ungeplante Arbeitsaufträge in die Bedarfsprognose ein, stellt Turnaround-Kits bereit und priorisiert die Beschaffung anhand der tatsächlichen Arbeitspipeline.
Signale der vorausschauenden Wartung in den Ersatzteilbedarf einspeisen
Für Betreiber, die ausgereifte Programme zur vorausschauenden Wartung betreiben, liefern IIoT-, Vibrations-, Wärme- und SCADA-Telemetrie frühe Signale für einen drohenden Anlagenausfall. Ein modernes MRO-System nutzt diese Signale, um Legen Sie die richtigen Ersatzteile bereit, bevor ein Ausfall zu einem Stockout wird. - Umstellung des MRO-Bestands von der reaktiven Notfallbeschaffung auf eine wirklich vorausschauende Wiederbeschaffung.
Die KPIs, auf die es ankommt
Ohne Messung kann nichts davon verwaltet werden. Die Betreiber, die ihre Bestände gut verwalten, verfolgen eine kleine, disziplinierte Reihe von Metriken über drei funktionale Achsen - die Bestände selbst, die Wartungsarbeiten, die sie unterstützen, und die Beschaffungsmaschine, die sie wieder auffüllt.
Der Vermögenswert selbst
- Umschlagshäufigkeit der Vorräte
- Verfügbarkeitsrate auf Lager
- Füllrate
- Servicelevel (Soll vs. Ist)
- Bestandsgenauigkeit (Buch vs. physisch)
- Buchhaltungskosten als % des Wertes
Was es ermöglicht
- MTTR (Mittlere Zeit bis zur Reparatur)
- Betriebszeit der Ausrüstung
- Stockout-Vorfälle pro Zeitraum
- Rate der Ersatzverfügbarkeit
- Erreichen des Zeitplans
- Rate der Notfallaufträge
Was sie wieder auffüllt
- Vorlaufzeit des Lieferanten (tatsächlich vs. angeboten)
- Zykluszeit für die Beschaffung
- Einkaufspreisabweichung (PPV)
- Pünktliche Lieferung durch den Lieferanten
- Ausgaben für Notfallbeschaffung
- Ausgaben unter Vertrag
Die Falle, in die die meisten Betreiber tappen, besteht darin, diese Zahlen isoliert auszuweisen. Der Lagerumschlag sieht großartig aus, bis Sie feststellen, dass die toten Bestände, die sich nicht bewegt haben, abgeschrieben und nicht in den Nenner eingerechnet werden.
MTTR sieht großartig aus, bis Sie erkennen, dass die Teilverfügbarkeit, die dies ermöglicht, in 40% überschüssiger Buchwert. Die Metriken müssen zusammen gelesen werden, wobei die Kompromisse sichtbar sein müssen, sonst wird die falsche Optimierung verfolgt.
Fazit
Der MRO-Bestand in der Öl- und Gasindustrie ist kein eindimensionales Problem. Es fächert sich in eine komplexe betriebliche Realität auf: Dutzende von Bestandskategorien, Ersatzteilklassifizierung über mehrere Dimensionen, sieben Kernfunktionen, zehn End-to-End-Prozessschritte und eine funktionsübergreifende Besetzung, die Wartung, Zuverlässigkeit, Betrieb, Beschaffung, Lieferkette, Lager und Finanzen umfasst.
Die Betreiber, die MRO richtig machen, sind diejenigen, die es in erster Linie als ein Datenproblem und erst in zweiter Linie als ein Logistikproblem behandeln. Dublettenfreie, attributreiche Ersatzteildaten. Granulare, KI-gestützte Kritikalitätsbewertung auf Teilebene - nicht pauschal von der übergeordneten Anlage geerbt. Dynamische Bedarfsprognosen, die Produktionszeitpläne, geplante Arbeitsaufträge und vorausschauende Wartung.
Bestellpunkte, die sich mit realen Vorlaufzeiten bewegen und nicht statische Felder, die seit drei Jahren nicht mehr aktualisiert wurden. Tote Bestände werden werksübergreifend sichtbar gemacht, so dass werksübergreifende Transfers vor neuen Bestellungen stattfinden. Und menschliches Fachwissen: Überschreibungen durch den Planer, Korrekturen durch den Ingenieur, Substitutionen im Lager: institutionalisiert durch verstärkendes Lernen, anstatt dass es bei der Pensionierung einzelner Personen einfach weg ist.
Die finanziellen Vorteile sind enorm: 15-25% Reduzierung des MRO-Betriebskapitals, Beseitigung von kritischen Ersatzteilausfällen, Wiederherstellung des Wertes von toten Lagerbeständen im siebenstelligen Bereich und ein messbarer Rückgang ungeplanter Ausfallzeiten, die auf die Nichtverfügbarkeit von Ersatzteilen zurückzuführen sind.
Der betriebliche Nutzen ist noch größer: Wartungsplaner, die sich auf ihre Bestandsdaten verlassen können, Zuverlässigkeitsteams, die Turnarounds mit den richtigen vorbereiteten Kits durchführen, und eine Anlagenbasis, die näher an ihrer theoretischen Betriebszeit liegt, anstatt Margen auf dem Tisch liegen zu lassen.
Die Zukunft der Bestandsverwaltung in der Öl- und Gasindustrie - durch die Energiewende hin zu LNG, Wasserstoff, CCUS und Offshore-Windkraft - hängt von derselben Grundlage ab: saubere Stammdaten, Kritikalität auf Teilebene, dynamische Prognosen und Lagerhaltungsstrategien, die scharf genug sind, um mit einer sich erweiternden Anlagenbasis umzugehen.
Das ist die Richtung, in die sich die Branche bewegt. Die Betreiber, die diesen Weg zuerst beschreiten, verwandeln die MRO von einer stillen Kostenstelle in eine messbare Quelle für Wettbewerbsvorteile.
Häufig gestellte Fragen
Was ist der größte Kostentreiber im MRO-Bestand der Öl- und Gasindustrie?
Ungeplante Ausfallzeiten, die durch die Nichtverfügbarkeit von Ersatzteilen verursacht werden. Untersuchungen der Industrie zeigen immer wieder mehr als die Hälfte der Maschinenausfallzeiten ist daran gebunden, dass die Ersatzteile nicht am richtigen Ort vorhanden sind. Der zweite Faktor ist das in toten Beständen gebundene Betriebskapital - typischerweise 20-35% des gesamten MRO-Bestandswertes bei Betreibern, die es nicht aktiv verwaltet haben.
Wie unterscheidet sich die Bestandsverwaltung in der Öl- und Gasindustrie von anderen Schwerindustrien?
Drei strukturelle Faktoren zeichnen Oil & Gas aus: extreme Vorlaufzeiten für Offshore- und abgelegene Standorte (oft 6-14 Wochen, manchmal 40+ Wochen für Artikel mit langen Lieferzeiten), hochtechnische und nicht austauschbare Teile von einzelnen OEMs bezogen werden, und die Paradoxon der gleichzeitigen Überbevorratung und Unterbevorratung durch ungenaue Kritikalitätsmodelle, die die Kritikalität von Anlagen pauschal auf Teile abbilden.
Wie viele Kategorien von Inventar verwaltet ein Öl- und Gasbetreiber normalerweise?
Typischerweise 15 verschiedene Kategorienin vier Gruppen unterteilt: Primär (MRO, Kapital, Kohlenwasserstoff), funktionsbasiert (Direktmaterialien, Verbrauchsmaterial, kritische Ersatzteile, Betriebsmittel, Sicherheitsbestand), Lebenszyklus (veraltet, Turnaround, In-Transit, Projekt) und Eigentumsmodell (VMI, Konsignation, Anlage). Darüber hinaus wird jede SKU anhand von sechs Dimensionen klassifiziert: Verwendung, Kritikalität, Bewegung, Wert (ABC), Lebenszyklus und Lieferrisiko.
Kann KI wirklich die traditionellen FMECA-Kritikalitätsbewertungen ersetzen?
Es ersetzt sie nicht - es ergänzt sie. Modelle wie FMECA, VED und ABC bleiben weiterhin gültig. KI fügt hinzu Granularität auf Teilebeneintegriert ERP-, EAM- und CMMS-Daten von Erstanbietern zusammen mit Industriekatalogen und OEM-Dokumentation und erstellt eine Bewertung. laufend aktualisiert und nicht nur ein einmaliges Workshop-Ergebnis. Mit der Verstärkung durch den Menschen in der Schleife geht das Expertenurteil nicht verloren, sondern wird institutionalisiert.
Was ist der Unterschied zwischen Verdantis MRO360 und einem CMMS oder EAM?
Ein CMMS oder EAM zeichnet Wartungsarbeiten auf und plant sie. MRO360 optimiert die Bestands- und Nachfrageebene die es unterstützt - Kritikalitätsbewertung, dynamische Prognosen, Nachbestellungslogik, Identifizierung toter Bestände und vorausschauende, wartungsgesteuerte Bedarfssignalisierung. Es lässt sich als intelligentes System in das CMMS / EAM integrieren, das auf den bestehenden IT-Investitionen aufbaut, anstatt sie zu ersetzen.
Wie lange dauert es, eine KI-native MRO-Inventarisierungslösung zu implementieren?
Der Zeitrahmen für die Implementierung hängt von der Datenqualität und dem Umfang ab, aber Plug-and-Play-Plattformen wie MRO360 werden in der Regel innerhalb von drei Monaten implementiert. Wochen bis ein paar Monate - einen Bruchteil der mehrjährigen Transformationsprogramme, die klassische ERP-Anpassungsprojekte erfordern. Stammdatenbereinigung durch Harmonisieren Sie können parallel dazu beginnen, mit messbaren Ergebnissen innerhalb des ersten Quartals.
Was ist mit der Kohlenwasserstoff-Bestandsaufnahme - gilt hier die gleiche Technologie?
Die Bilanzierung von Kohlenwasserstoffbeständen ist eine Spezialdisziplin, die in der Regel von speziellen Lösungen (Quorum, P2 und anderen) erledigt wird. Allerdings ist die Stammdatengrundlage - Zähler, Tanks, Pipelines, Brunnenklassifizierungen - befindet sich im ERP und profitiert direkt von Verdantis MDM Suite Verwaltung. Saubere Anlagenstammdaten sind die Voraussetzung für eine genaue Buchführung über Kohlenwasserstoffe, unabhängig von der Buchführungsplattform, die darauf aufbaut.