

MRO Inventory management in oil and gas industry isn’t a balance-sheet detail. It’s the line between a producing well and a multi-million-dollar daily loss and the discipline that decides whether oilfield operations, refineries and depots hit their numbers.
A single offshore production platform can defer $500,000 to over $1 million per day when one critical part isn’t available on site. A refinery turnaround that runs four days long because of a missing valve assembly can cost $25-50 million in lost margin. And drilling rig non-productive time (NPT), where the spread cost alone runs $80,000 to $1 million per day depending on rig class is, by industry estimates, over 30% attributable to equipment and parts issues.
And yet, the same operators losing money to stockouts are simultaneously sitting on warehouses full of dead stock. Industry surveys consistently put the share of inactive MRO inventory at 20-35% of total spares value, with some asset-intensive operators finding even higher figures once a real audit is run.
This is the central paradox of Oil & Gas inventory management: simultaneous overstocking and understocking, often within the same business unit, and frequently within the same warehouse.
This guide breaks down what oil and gas inventory management actually involves — the complete taxonomy of inventory categories, warehousing strategies across upstream, midstream and downstream sites, the structural challenges that make MRO in oil & gas harder than in any other heavy industry, the end-to-end process, the KPIs that matter, the inventory management software stack, and what a modern, AI-native approach looks like in practice.
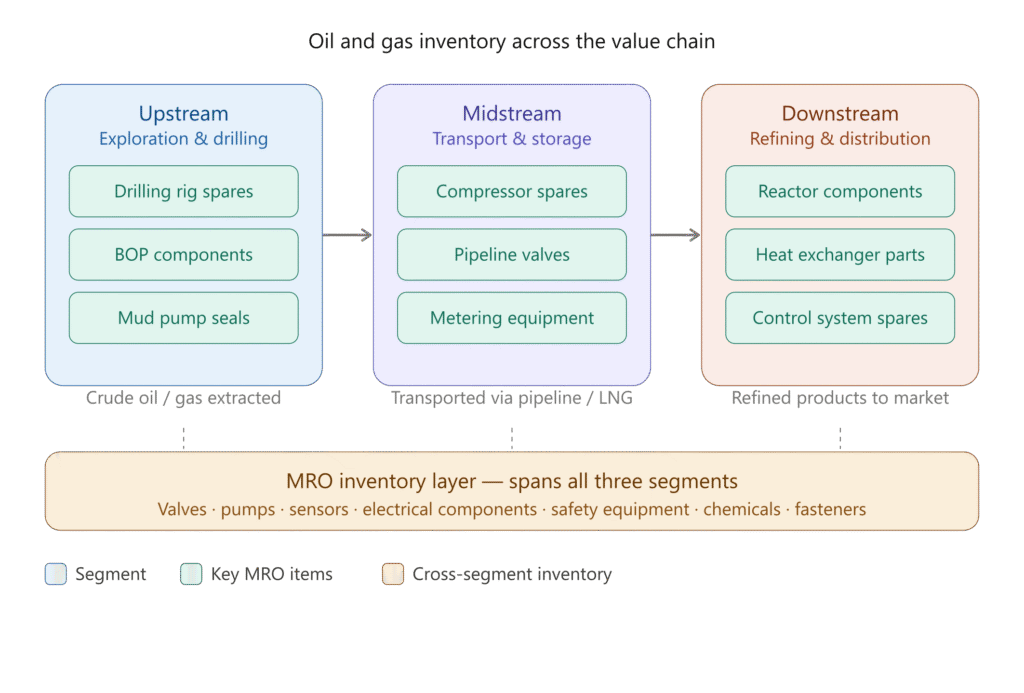
From upstream drilling sites to refineries, terminals and pipelines, inventory in the oil & gas industry spans MRO spares, capital equipment, hydrocarbons, drilling chemicals, OCTG tubulars, and surplus material, all governed by different rules, owners, and risk profiles.
This guide covers what oil & gas inventory management actually involves: the categories, warehousing strategies, MRO discipline, accounting treatment, KPIs, software selection criteria, and what an AI-native approach looks like in practice.
What is Oil & Gas Inventory Management?
Oil & gas inventory management is the process of tracking, organising, controlling, and optimising all materials, spare parts, equipment, consumables, and supplies used across oil & gas operations — from upstream drilling sites to refineries and downstream distribution facilities.
It ensures the right materials are available at the right location, at the right time, and in the right quantity, while minimising excess stock, duplicate inventory, and operational downtime.
What Does O&G Inventory Include?
Typical inventory in an Oil & Gas operation spans a broad range of physical materials, each with its own lifecycle, ownership model, and risk profile:
-
- MRO (Maintenance, Repair & Operations) spare parts for drilling equipment, refining valve systems, gas compression units, motors and hydraulic systems – bearings, valves, gaskets, fasteners, electrical and instrumentation components
- Pipes, valves, fittings, flanges, and OCTG tubulars (casing, tubing, drill pipe)
- Pumps, motors, compressors, turbines – the rotating equipment that drives MRO services demand across the oil & gas equipment market
- Onshore and offshore drilling equipment, subsea systems and rig components
- Petroleum product storage tank components – floating roof seals, vapour recovery parts, mixers
- Safety equipment and PPE: fire extinguishers, gas detectors, emergency kits
- Chemicals and lubricants: drilling muds, completion chemicals, corrosion inhibitors
- Waste management system parts: filters, membranes, separator internals
- Consumables and warehouse supplies: welding rods, cleaning chemicals, packaging
Two-week turnaround, no commitment.
Stakeholders: Who Actually Owns Inventory?
Departments Involved
Purchasing materials, supplier negotiation, contract management
Storage, issue management, cycle counting, physical custody
Spare-part planning, work-order consumption, reliability decisions
Demand generation, production scheduling, consumption
Oil and gas inventory accounting, inventory valuation, carrying-cost analysis, working capital management, write-offs
Technical specifications, BOM definition, OEM relationships
End-to-end coordination, logistics, lead-time management
System integration, data flow, technical support
Material master quality, MDM standards, taxonomies
Safety compliance, hazardous materials, PPE management
Internal Stakeholders
Maintenance teams · plant operations · procurement · supply chain leadership · warehouse teams · reliability engineering · finance · IT & ERP teams · HSE teams.
External Stakeholders
Suppliers · OEMs · third-party logistics providers · contractors · auditors · regulatory bodies (e.g. BSEE, HSE-UK, NOPSEMA depending on jurisdiction).
Supply Chain Roles
Strategic sourcing managers · category managers · buyers · inventory controllers · warehouse supervisors · material coordinators · maintenance planners · reliability engineers · shutdown planners · logistics coordinators · master data analysts · MDM specialists · cost controllers.
Why Inventory is Critical in Oil & Gas
Oil & Gas operations are asset-intensive, and downtime is extremely expensive. Poor inventory management directly creates:
- Production shutdowns and deferred output
- Delayed maintenance activities and longer MTTR
- Emergency procurement at premium cost (often 5-10x standard rates)
- Overstocking and tied-up working capital
- Duplicate materials across plants and sites
- Obsolete inventory accumulation and write-offs
- Safety and regulatory compliance risks
For example, if a refinery doesn’t have a critical pump seal or valve available during a breakdown, production losses can run into millions per day – and the emergency procurement cost to recover is a fraction of the deferred margin lost.
Inventory in oil & gas is inseparable from equipment maintenance management – every work order generates a spare-parts demand signal, and every stockout delays a maintenance job.
Before getting into specifics, it’s important to recognise that “inventory” in Oil & Gas isn’t one thing. It’s three very different primary categories – each with its own physics, its own accounting treatment, and its own management discipline.
The Real Cost of Poor Inventory Management
Before examining best practices, it’s worth quantifying what poor inventory management actually costs. The numbers make an undeniable business case for investment in this function.
~$500K
Cost of one hour of unplanned downtime in oil & gas, more than doubled between 2019 and 2022 in line with rising oil prices
$149M
Average annual loss per O&G facility at peak 2022 oil prices. Worst performers exceed $88M even in standard conditions
36%
Reduction in unplanned downtime achieved by data-driven vs. reactive maintenance strategies
Unplanned downtime is the most visible cost, but it’s not the only one. Overstocking, the opposite failure mode, silently destroys value by tying up working capital in slow-moving or obsolete parts.
Research consistently shows that 10-20% of material master records in large oil and gas companies are duplicated, generating redundant procurement and excess inventory.
An oil and gas exploration and production company was using a blanket Min-Max inventory control policy across all 4,200+ spare parts in its MRO warehouse, regardless of part value or criticality. The result was high carrying costs on low-priority items and inadequate coverage for the parts that actually mattered.
Researchers applied ABC classification to segment the inventory: just 7% of parts accounted for 74% of total inventory value. Switching high-value A-items to a continuous review (Q, r) model allowed the company to reduce inventory investment while improving service levels. Source: Improved MRO Inventory Management System in Oil and Gas Company, MDPI
Score yourself on the Spare Parts Maturity Index.
A benchmark score across 6 dimensions: criticality, demand planning, stockout risk, data quality, obsolescence & supplier reliability, and predictive maintenance. Get a detailed report with gaps and remedial approaches
The Three Main Categories of Oil & Gas Inventory
The Three Pillars of Oil & Gas Inventory
Indirect Materials (MRO)
Replacement parts and consumables that keep production assets running — valves, pumps, seals, drill bits, lubricants, chemicals. The single biggest inventory challenge in Oil & Gas.
Capital Materials
Tubular pipes, casing, drill pipes, heavy machinery staged for refinery expansions or new wells. CapEx classification differs, but operational handling mirrors MRO.
Hydrocarbon Inventories
The product itself — crude, gas, NGLs — tracked in volumes across tanks, pipelines, and terminals. Heavily technical, governed by API/ISO standards, and full of reconciliation challenges.
1. Indirect Inventory (MRO)
These are the replacement parts and consumables that keep production assets running. They need to be in the right quantity, at the right site, at the right time – or production stops.
Examples: bearings, valves, safety equipment, electrical spares, gaskets, fasteners, pumps, motors, lubricants, drilling muds, completion chemicals, drilling fluids, corrosion inhibitors, demulsifiers, hand tools, PPE.
This is the single biggest inventory challenge in Oil & Gas operations – and the central focus of this article.
2. Capital Inventory
These are the high-value strategic spares and large-scale infrastructure components – turbines, compressors, OEM assemblies, tubular goods (OCTG), pipelines, drill pipes, casing, tubing, large transformers, heavy equipment staged for new drilling sites or refinery expansions.
Casing, tubing, and drill pipes are consumed during the construction of the asset itself. When a well is drilled, kilometres of casing are cemented permanently into the ground. They are physical inventory until the moment they’re installed – at which point they become part of the well, not part of the storeroom.
While these items are physical materials, their classification as capital expenditures (CapEx) typically excludes them from indirect MRO categories in financial reporting. Tax treatment, depreciation schedules, and project accounting all live in a different regime.
But operationally? Storerooms manage them similarly to MRO: warehousing, lead-time pressure, supplier relationships, and stockout risk all behave the same way. For most of this article, we treat categories 1 and 2 together under the umbrella of “indirect materials.”
Practical OCTG inventory management means tracking by joint, every length of casing has a unique mill ID, grade and connection type and keeping pipe-yard visibility across operator and contractor yards so the same string isn’t ordered twice.
3. Hydrocarbon Inventory
This is the revenue-generating product itself crude oil, diesel, LNG, LPG and bottled gas, heating oil, bulk lubricants, fuel inventory in retail and dispatch networks, jet fuel, NGLs, condensates and refined products.
Hydrocarbon inventory management is a different discipline entirely. It’s heavily technical, governed by API and ISO measurement standards, and full of structural challenges: product uniformity is rarely guaranteed, measurement carries inherent inaccuracies, the physical state changes constantly, and regulatory and fiscal exposure is direct. We’ll cover this in detail later.
Sub-disciplines inside this category include LPG inventory management (combining bulk pressurized storage with returnable cylinder fleets), heating oil inventory management at depots and customer tanks, fuel inventory and dispatch management for petroleum retailers, and hydrocarbon allocation back to producing wells and streams.
Minimum operational inventory of oil – the floor below which a refinery or terminal cannot run — sits inside this regime.
The Complete Taxonomy: 15 Categories of Oil & Gas Inventory
In practice, the three pillars above expand into a much richer taxonomy. A mature operator typically tracks fifteen distinct inventory categories, each with its own planning method, MRO procurement strategy, storage controls, financial treatment, and risk profile.
Understanding which category a given item belongs to drives how it’s managed. A consumable lubricant and a turbine rotor cannot and should not be governed by the same rules.
15 categories, organised by function
Bearings, valves, safety gear, electrical spares.
Turbines, compressors, OEM assemblies, large transformers.
Crude oil, diesel, LNG, jet fuel, NGLs.
Drilling chemicals, catalysts, process additives, production chemicals — directly consumed in production.
Gloves, welding rods, lubricants, batteries, cleaning supplies. Fast-moving by nature.
Compressor seals, critical pump assemblies, turbine blades. Managed via asset criticality analysis.
Drilling pipes, field equipment, rig supplies, production tubing. Mostly upstream.
Extra stock to handle demand uncertainty, supplier delays, and operational risk.
Old equipment models, expired chemicals, legacy spare parts. A major financial issue.
Shutdown kits, temporary equipment, bulk maintenance spares for planned outages.
Materials moving between suppliers, warehouses, platforms, and plants. Tracked by logistics teams.
Inventory dedicated to plant construction, expansion projects, EPC projects. Construction materials and project-specific equipment.
Inventory owned or replenished by suppliers at customer locations. Common for fasteners, PPE, consumables.
Stored onsite but owned by supplier until consumption. Helps reduce working capital exposure.
Pallets, packaging materials, forklift batteries — supporting warehouse and facility operations themselves.
This many categories exist because Oil & Gas operations are highly asset-intensive, safety-critical, geographically distributed, and extremely costly during downtime.
Each MRO category management requires different planning methods, procurement strategies, storage controls, financial treatment, risk management, and optimization models.
Treating all of them with one set of rules which still happens at many operators is precisely what creates the simultaneous overstocking and stock out paradox.
Multi-Dimensional Classification
The 15 categories tell you what an item is. But operationally, every item is also classified across multiple dimensions simultaneously and these classifications determine how the item is planned, procured, stored, and managed.
Six Dimensions Every SKU Gets Classified Against
A single critical pump seal might be: Indirect · Critical · Slow-moving · A-class value · Aging · Long-lead. Each dimension drives different controls.
By Usage
By Operational Criticality
By Movement
By Value (ABC)
By Lifecycle
By Supply Risk
Example: Inside a Single Refinery Warehouse
To make all of this concrete: here’s a slice of what a single refinery warehouse might contain on any given day, across the categories we’ve just defined.
A Snapshot:Inventory mix in a typical refinery warehouse
Category | Example Item |
Hydrocarbon | Diesel storage in product tanks |
Indirect / MRO | Bearings for unit pumps |
Capital | Turbine rotor staged for major overhaul |
Consumables | Lubricants and grease supply |
Shutdown Inventory | Turnaround valve kits |
Safety Stock | Emergency mechanical seals |
Obsolete | Legacy pump spares from decommissioned units |
Project Inventory | Expansion project construction materials |
One warehouse. Eight different categories. Eight different sets of rules for procurement, storage, financial treatment, and disposal.
That’s the scale of complexity even a single site has to manage multiply that across an operator’s fleet of plants, terminals, platforms, and rigs, and the challenge starts to come into focus.
Why MRO Inventory in Oil & Gas Is Uniquely Difficult
Most heavy industries deal with MRO inventory. None deal with it on Oil & Gas terms. Five structural challenges break classical inventory theory.
1. Abnormally Long Lead Times.
A part that lands at a Midwestern plant in 48 hours can take 6-14 weeks to reach a North Sea platform and 40-52 weeks for long-lead, custom-engineered items like specialty valves or subsea control modules. The logistics chain (ocean freight, supply vessels, weather windows, helicopter availability) makes textbook reorder points meaningless.
Lead time in Oil & Gas inventory management has to be tracked dynamically — by site, by part, and by supplier. It cannot be a static field in the ERP that nobody has refreshed in three years.
2. The Technical Nature of Parts.
Subsea Christmas trees, BOPs, gas-compression cylinder packs, refining valve internals and mud pump fluid ends are not generic. Most are single-OEM, proprietary, and non-substitutable which is why the MRO services market for oil & gas equipment is structurally fragmented across drilling, refining, gas processing, subsea and storage asset classes.
The data problem this creates is severe in a typical operator with 20+ plants, a single part (a 2-inch ball valve, ANSI 600, WCB body) routinely exists as 5-15 different SKUs with inconsistent descriptions, missing attributes, orphaned BOM links, and obsolete entries still active. Master data quality is the precondition for everything else.
3. Modern Industry, Legacy Inventory Practices.
The same operators running digital twins on billion-dollar assets manage MRO on Excel and rule-based ERP modules from two decades ago.
Min-max levels go un-reviewed, criticality scoring is done in offline workshops every few quarters, and inter-plant visibility is poor. Purpose-built AI like Verdantis’ MRO360 now closes this gap without ripping and replacing the ERP.
4. The Overstocking-and-Understocking Paradox.
Operators simultaneously:
- Hold 20-35% dead stock — parts inactive 5+ years
- Stock out on critical consumables, triggering emergency air-freight at 5-10x standard cost
- Hold near-duplicate spares across plants, blind to each other
- Carry safety stock built on assumptions that no longer reflect reality
Both ends of the paradox stem from the same root: inventory levels aren’t aligned to actual criticality and consumption patterns. A 15-25% reduction in MRO working capital is a realistic target hundreds of millions released for any large operator.
5. Criticality Assessments That Don’t Reflect Reality.
FMECA, VED, and ABC are valid frameworks. The problem is application:
- Asset-level criticality is mapped wholesale onto parts – but a non-critical compressor with a sole-source 40-week seal is, in practice, critical.
- It’s a one-time exercise, not a continuous process – assessments are stale by the time they’re published.
- It doesn’t integrate real operational data – failure rates, supplier reliability, work-order pipelines, BOM structures.
This is exactly the gap MRO360 closes running criticality at the part level with 25+ ERP, EAM, and CMMS data points, an ML scoring model trained on industry-specific failure modes and substitutability, written justifications for every score, and human-in-the-loop overrides that turn plant-level expertise into global institutional knowledge.
6. Turnaround & Shutdown (TAR) Inventory Planning
A plant turnaround (TAR) is a scheduled, periodic shutdown of all or part of an oil and gas facility for comprehensive inspection, maintenance, and upgrades.
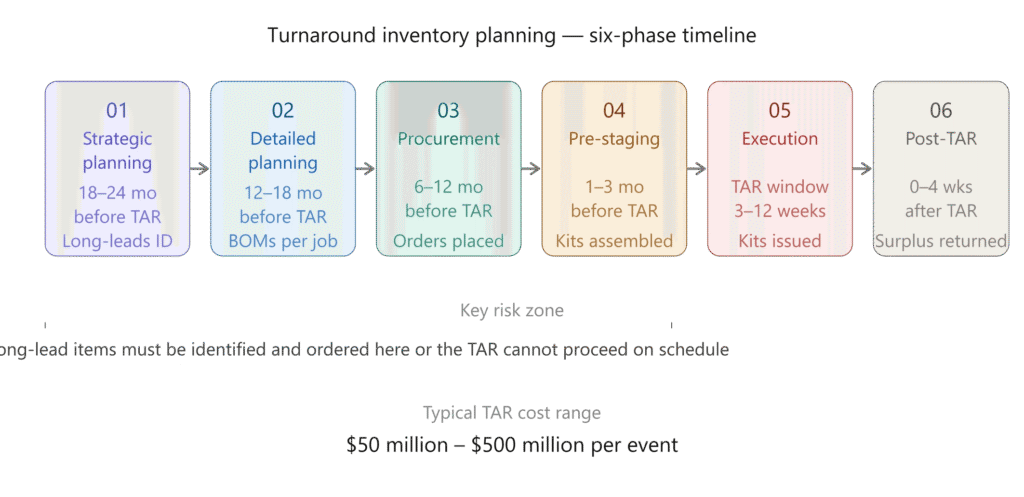
Turnarounds occur every 3-5 years and represent some of the most complex and expensive events in the industry, often costing $50M–$500M and taking 3–12 weeks to execute. (Source: Oil & Gas IQ: Shutdowns and Turnarounds)
During normal operations, inventory is managed for steady-state demand. During a TAR, demand spikes simultaneously across hundreds of work orders.
Every bolt, gasket, valve, and specialty tool must be on-site before the plant goes offline, because once the clock starts running, there is no time to wait for deliveries.
TAR-Specific Inventory Considerations
- Pre-Kitting: Assembling and staging all materials for specific work packages before shutdown begins, enabling maintenance crews to pick up a complete kit rather than search for individual items
- Long-Lead Items: Specialty valves, large rotating equipment spares, or custom-fabricated parts may have 12 to 52 week lead times, requiring identification and ordering 12-18 months before the TAR
- Surplus Management: Post-TAR, unused staged materials must be returned, restocked, or reclassified, a process that requires clean material data to execute efficiently
- Contractor Material Accountability: TARs bring thousands of third-party contractors who must be tracked for material consumption against specific work orders
TAR Planning Timeline
Phase | Timeline Before TAR | Key Inventory Activities |
Strategic Planning | 18-24 months | Define scope, identify long-lead items, update criticality ratings |
Detailed Planning | 12-18 months | Develop work packages, create material BOMs per job, place long-lead orders |
Procurement | 6-12 months | Order standard materials, confirm supplier lead times, inspect received goods |
Pre-Staging | 1–3 months | Kit materials by work package, stage in pre-assigned warehouse zones |
Execution | During TAR | Issue kits to work crews, track consumption in real time, manage surplus |
Post-TAR | 0-4 weeks after | Return surplus, update material master, reconcile BOM actuals vs. plan |
Shell began planning the Athabasca Oil Sands Project turnaround in 2007, three years before the 2010 execution window. The event involved over 4,500 contractors, more than 250 new valve installations, and a multi-million-dollar materials program managed across multiple procurement waves.
The project completed on time and within budget. The key differentiator: early identification of long-lead specialty materials, multi-year supplier framework agreements, and integrated digital planning systems that tied work order BOMs directly to procurement and warehouse staging.
The lesson is clear: TAR inventory success is determined years before the shutdown begins, not in the final weeks. Source: Oil & Gas IQ
Verdantis MRO360 helps oil & gas operators cut MRO inventory by 15–25% while eliminating critical-spare stockouts — without replacing your existing ERP or EAM. Most deployments show measurable savings inside one quarter.
Request a Live DemoThe Seven Core Functions of Inventory Management
An effective inventory operation isn’t a single activity – it’s a discipline made up of seven interconnected functions. A weakness in any one of them compromises the whole system.
Inventory Tracking
Monitoring stock levels, locations, movements, and usage in real time across warehouses, offshore platforms, terminals, and plants. The foundation everything else depends on.
Spare Parts Management
Ensuring critical spares are available for equipment maintenance and turnaround activities — with the right balance between availability and carrying cost.
Material Master Data Management
Standardising item descriptions, classifications, units of measure, and specifications to eliminate duplicates and improve procurement accuracy. The precondition for every other function. This is exactly where Verdantis Harmonize operates.
Stock Optimization
Balancing inventory availability with carrying costs by identifying excess stock, slow-moving items, dead inventory, and critical materials — and adjusting reorder logic accordingly.
Procurement & Replenishment
Automating reorder points and ensuring timely purchasing of materials — with dynamic lead-time tracking and supplier reliability built into the logic.
Warehouse Management
Warehousing strategies in oil and gas span centralised hub-and-spoke models, decentralised site-resident stores, vendor-managed inventory and consignment, and pooled multi-operator stocking.
Inside the warehouse: storage locations, bin tracking, receiving, issuing, cycle counting, and hazardous-material segregation under OSHA PSM, ATEX and IECEx. The physical layer that supports everything else and one of the largest levers on working capital efficiency.
Criticality Analysis
Prioritising inventory based on operational risk, equipment importance, lead time, substitutability, and consequence of failure. This is where AI-native scoring genuinely outperforms classical workshop methods.
The End-to-End Inventory Management Process
At a process level, inventory management runs as a closed loop of ten steps from the moment a material need is identified through to the analytics that feed the next cycle of optimisation. Each step has its own system of record, its own owner, and its own failure modes.
Demand Identification
The need for materials is triggered by maintenance plans, shutdown schedules, production requirements, or emergency breakdowns. Modern systems also pick up demand signals from predictive maintenance and IIoT data.
Material Master Validation
The item is checked in the ERP system to avoid duplicate creation, incorrect specifications, or wrong units of measure. Typically managed through MDM platforms like Verdantis Integrity, SAP MDM or SAP Master Data Governance, or IBM InfoSphere MDM.
Inventory Check
The warehouse verifies current stock, reserved stock, safety stock, and existing purchase orders — ideally with visibility across plants to surface inter-plant transfer opportunities before triggering a new purchase.
Procurement Process
If stock is unavailable, an RFQ is issued, a vendor selected, and a purchase order created — usually in systems like SAP S/4HANA or Oracle ERP Cloud.
Receiving & Inspection
Materials are inspected, quality-checked, tagged or barcoded, and stored in designated warehouse bins. Inspection failures here trigger non-conformance procedures and supplier feedback.
Warehousing & Storage
Materials are organised by warehousing strategy (central hub, site-resident, VMI, consignment), hazard classification, temperature requirements, criticality, and frequency of use.
Hazardous chemicals, ATEX-rated equipment, high-value spares and secure inventory for offshore rig parts all need different handling regimes.
Inventory Monitoring
Continuous monitoring of stock levels, consumption rates, shelf life, and min/max thresholds. This is where AI-driven anomaly detection genuinely outperforms rule-based alerts.
Material Issue & Usage
Materials are issued to maintenance jobs, turnarounds, drilling operations, and production units — with consumption recorded back against the originating work order.
Cycle Counting & Audits
Regular physical verification ensures ERP accuracy, shrinkage control, and audit compliance. The gap between book and physical is a leading indicator of process health.
Optimisation & Reporting
Analytics identify excess inventory, obsolete stock, duplicate materials, and overstocked categories — and feed the loop back into demand forecasting and reorder logic. This is the close of the cycle and the start of the next.
Technologies Powering Modern Oil & Gas Inventory
The right oil and gas inventory management software is rarely one tool, it’s a stack of four layers, each with distinct pros and cons.
Operators evaluating an inventory management system, tracking solution, or oil depot management platform usually need ERP for the transactional spine, EAM/CMMS work order management software for asset and work-order context, an MDM suite for the spares master, and an AI-native MRO intelligence layer on top.
IBM Maximo, SAP PM, Oracle eAM, Infor EAM — where every asset, equipment BOM, and maintenance work order lives. MRO inventory only makes sense when the EAM hands off planned consumption to the storeroom in real time.
SAP Materials Management-IM and MM-CBP, Oracle ERP Cloud Inventory. The transactional spine — material masters, stock balances, reservations, goods movements, and purchase orders. Foundation for everything; not enough on its own.
Replaces static min-max with dynamic models that learn from real consumption, production schedules, planned work orders, and predictive maintenance signals. The only way to forecast intermittent demand on long-tail, slow-moving spares.
Multi-variable ML scoring at the SKU level — failure modes, supplier reliability, substitutability, lead time, safety consequence. Replaces FMECA / VED workshops with continuous, data-driven scoring. This is where Verdantis MRO360 operates.
Vibration, thermal, acoustic, and SCADA telemetry predicting which assets are about to fail — so the right spares get pre-positioned before a stockout becomes a production outage. Demand becomes anticipatory, not reactive.
Without deduplicated, classified, attribute-rich material master records, every analytics layer above runs on garbage data. Verdantis Harmonize cleans legacy spares; Integrity governs new records at source with configurable approval workflows.
AI extracts asset BOMs from OEM PDFs, supplier catalogues, and engineering drawings — auto-linking spares to equipment and functional locations. Without it, criticality and demand cannot be scored against the actual installed base.
Bin-level tagging, handheld scanners, and mobile material issue. Without trustworthy physical-to-book accuracy, every reorder calculation and criticality score above is built on numbers planners don't believe.
Cross-site stock pooling that surfaces inter-plant transfer opportunities before triggering a new purchase. The single fastest way to dent dead-stock value — and one most operators have no visibility into today.
Real-time ROP calculation using current lead time, daily usage, and live safety stock — not the three-year-old number sitting in the ERP field. Critical for offshore and remote sites where lead times are long and variable.
Tracks actual supplier delivery performance by part, by site, by season — and feeds it back into reorder logic and criticality scoring. Sole-source and high-risk-supplier flags surface before they become production outages.
Virtual asset replicas simulating failure modes to pre-validate the exact spares each scenario will consume. BOMs, turnaround kits, and capital spares pools sized against real failure probabilities — not planner intuition.
These layers don’t replace each other they compose. Equipment Asset Management Software/CMMS sit at the foundation with the ERP inventory module alongside. The data layer (MDM, asset BOMs, parts-to-equipment linkage) governs everything above it. The warehouse layer makes physical inventory trustworthy.
The procurement layer keeps reorder points and supplier data live. And the intelligence layer – AI forecasting, part-level criticality, predictive signals runs the optimization loop.
Verdantis MRO360 operates as that intelligence layer, with Harmonize and Integrity governing the data layer beneath. The whole stack plugs into the EAM and ERP an operator already runs, not replaces them.
How AI Native Platform Changes the Game for MRO
MRO inventory in Oil & Gas shares one common root problem: the underlying data is messy, fragmented, and rarely trusted by the planners making decisions on top of it. Duplicate part records. Inconsistent descriptions across plants. Stale criticality scores. Lead-time fields nobody has refreshed in three years. Asset BOMs trapped in OEM PDFs nobody links back to the storeroom.
Spreadsheets and rule-based ERP modules cannot solve this at scale. Static FMECA matrices, refreshed once a year, cannot keep up with a global asset base where suppliers, lead times, and configurations change quarterly. And generic AI tools, trained on consumer data miss the deep technical context that spares, BOMs, and OEM catalogues demand.
What works is purpose-built, industry-trained AI, context-aware on millions of spare-part descriptions, asset BOMs, OEM catalogues, supplier records, and failure patterns specific to Oil & Gas operations.
This is the design philosophy behind the two Verdantis suites:
The EAM Suite – MRO360
The inventory intelligence layer that runs the full MRO loop on top of an operator’s existing EAM and ERP — no rip-and-replace required:
- AI-native part-level criticality – multi-variable ML scoring across 25+ ERP, EAM, and CMMS data points: failure modes, lead times, substitutability, sole-source risk, safety consequence
- Dynamic demand forecasting – overlays statistical models with agentic AI that accounts for production volumes, planned and unplanned work orders, and predictive maintenance signals
- Reorder point optimisation – recalculated continuously against live lead times and safety-stock targets, not the three-year-old number in the ERP field
- Work-order integration – planned consumption from the EAM flows straight into demand, so inventory anticipates work rather than reacting to it
- Predictive-maintenance-driven demand signalling – IIoT and SCADA telemetry pre-positions spares before failure becomes a stockout
- Dead-stock identification and inter-plant transfer – surfaces dormant inventory and recommends transfers before triggering a new PO
- Parts Intelligence agent – wrapped throughout, continuously mapping obsolete parts to their alternatives, technical descriptions, specifications, and substitutability across the installed base
The MDM Suite – Harmonize + Integrity
The data foundation MRO360 sits on. Without clean, deduplicated, attribute-rich material master data, every analytics layer above runs on numbers planners don’t trust.
- Harmonize – the patented master data normalisation engine. Standardize legacy material, asset, supplier, and services master data automatically. Trained on industry-specific catalogues and taxonomies (UNSPSC, eClass), with Auto-Enrich AI for attribute extraction from OEM documentation and Agentic AI for technical specification recovery from unstructured PDFs and catalogues. Identifies duplicates across plants, links spare parts to asset BOMs, flags obsolete records.
- Integrity – the active governance layer that monitors master data records at the point of creation, ensuring completeness and correctness with configurable approval workflows. Continuous data quality monitoring catches degradation before it spreads. Stops bad data getting into the ERP in the first place, rather than cleaning it up six months later.
Why this works
We’re not in the business of selling buzzword AI. The models work because the data layer underneath them is built right and a human-in-the-loop reinforcement workflow ensures domain expertise gets institutionalized, not bypassed:
- When a senior maintenance planner overrides a criticality score, MRO360 learns.
- When a reliability engineer corrects a part-to-asset linkage, the correction propagates across plants.
- When a storeroom team identifies a valid substitute for an obsolete part, the substitution becomes available to every other site.
Plant-level expertise becomes global institutional knowledge instead of walking out the door when individuals retire.
Offshore vs. Onshore Inventory Management
The physical environment of oil and gas operations fundamentally changes inventory strategy. Offshore platforms and remote onshore sites face constraints that make standard supply chain assumptions inapplicable.
|
Factor |
Offshore (Platform / FPSO) |
Onshore (Refinery / Pipeline) |
|
Space |
Extremely limited: every SKU must justify its footprint, as deck space is at a premium |
Relatively flexible, with large warehouses possible near the facility |
|
Resupply Lead Time |
Hours to days via helicopter or supply vessel; weather-dependent and costly |
Hours via road freight; same-day or next-day common |
|
Stockout Consequence |
Potentially weeks without a replacement part, while production loss compounds daily |
Typically resolvable in hours with local suppliers |
|
Hold more insurance spares on-site despite high carrying cost. JIC dominates here. |
Lean stocking viable for most items; emergency procurement accessible |
|
|
Inventory Tracking |
RFID and barcode essential; manual tracking too error-prone in harsh conditions |
Both manual and automated approaches viable |
|
Regulatory Compliance |
SOLAS, MARPOL, OPRC for hazmat; platform-specific safety regulations |
OSHA PSM, EPA Tier reporting, local environmental laws |
|
Workforce |
Specialist technicians rotate on 2–4 week cycles; knowledge continuity is a risk |
Fixed local workforce with daily site access |
Offshore operators with the worst performance experience $88M+ in annual downtime costs per Kimberlite's oil and gas market research study . Much of this is attributable to parts unavailability, a problem that cannot be solved at the moment of failure, only through proactive inventory planning months in advance.
Oil & Gas Inventory Accounting & Valuation
Inventory in oil & gas does not sit on one line in the general ledger. It is split across three accounting regimes that finance, operations, and reliability teams all touch differently:
- MRO and consumables – treated as operating expense once issued to a work order, but capitalised on the balance sheet while in the storeroom. Carrying cost typically runs18–25% of inventory value per year when you factor in capital, storage, insurance, obsolescence write-offs and shrinkage.
- Capital materials and tubulars (OCTG) – held as project inventory until installed, then capitalised into the asset and depreciated. Casing and tubing convert from inventory to fixed asset the moment they go downhole.
- Hydrocarbon inventory – valued under fiscal and accounting rules that vary by jurisdiction and product. Crude held in tank farms is typically valued at lower of cost or net realisable value (LCNRV); refined products move under FIFO, weighted-average or specific identification depending on the operator’s accounting policy.
The reconciliation problem is real. Hydrocarbon volumes flowing through tanks, pipelines, separators and meters never net to zero on paper – measurement uncertainty, temperature/pressure corrections, evaporation, and metering tolerances all create unaccounted-for product that has to be allocated back to streams under hydrocarbon allocation rules. Most operators tolerate a 0.5–1.5% allocation gap; anything larger triggers an audit.
Carrying-cost reduction, write-off elimination, and clean hydrocarbon allocation all share one prerequisite: trustworthy master data. Bearings, valves, meters and tanks have to resolve to a single record across every plant before any accounting view of inventory is defensible.
Benefits of Getting The Inventory Right
The financial and operational upside of running Oil & Gas inventory well is substantial and measurable. Operators that move from reactive to modern inventory management consistently see outcomes across eight dimensions:
In most Oil & Gas organisations, inventory management is closely connected with asset management in oil and gas, maintenance planning, supply chain operations, master data management, reliability engineering, and turnaround / shutdown planning. Improving any one of these without the others is the wrong scope. Treat inventory as the connective tissue and the gains compound.
Best Practices for Oil & Gas MRO Inventory Management
Given the challenges and the structural complexity above, what does a high-performing approach actually look like?
The following sequence is what works in practice across operators who have moved from reactive to genuinely modern inventory operations.
Normalize the Spares Master Data First
Every downstream MRO analytic — criticality, forecasting, reorder points, MRO spend analysis, category strategies across the oil & gas spares portfolio — runs on the spare-parts master. Deduplicate, classify, and enrich legacy records. Standardise descriptions to taxonomy (UNSPSC, eClass), extract technical attributes from OEM documentation, identify duplicate SKUs across plants, and link spares to assets through BOMs. This is exactly what Verdantis Harmonize automates at scale, with Integrity governing every new record at creation.
Run Criticality at the Part Level, Not the Asset Level
A non-critical compressor can contain a single-source seal with a 40-week lead time — that seal is critical regardless of the asset ranking and assessment. Rebuild criticality at the SKU level using: dynamic lead time, supplier reliability and sole-source concentration risk, substitutability, failure consequence (production, safety, environmental), historical failure rate, cost, and obsolescence risk. MRO360 scores parts continuously, not in annual workshops.
Forecast Spares Demand Dynamically
Static min-max levels are the silent enemy of MRO. Demand for spares is intermittent and lumpy — classical time-series models fall apart on it. Modern forecasting blends historical consumption, production-volume changes, planned and unplanned work orders, predictive maintenance signals from IIoT, and industry-trained OEM failure-mode context to produce reliable demand on the long tail.
Make Lead Time a First-Class Variable in Reorder Points
The formula — Reorder Point = (Average Daily Usage × Lead Time) + Safety Stock — is correct. The problem is operators run it on stale lead-time fields and static safety stock. In Oil & Gas, lead time is a moving target by part, by site, by season. Track it dynamically. Recalculate reorder points weekly for high-criticality spares — not once a year for everything.
Activate Dead Stock and Enable Inter-Plant Transfers
The 20-35% of MRO inventory sitting as dead stock isn't lost value — it's locked value. Once it's visible across plants, options open: inter-plant transfer before triggering a new PO, return to supplier for credit, salvage liquidation, OEM trade-in, reclassification against active BOMs. Most operators leave 7-figure recoverable value on warehouse shelves simply because they can't see what they have.
The same logic applies to oil and gas surplus material management — surplus OCTG from completed wells, surplus turnaround materials, used oil and waste oil inventory awaiting recycling. Standardized spec data is what turns surplus from a write-off into a recoverable inter-plant or basin-wide reclassification.
Integrate the EAM Work-Order Pipeline with Inventory
Maintenance work orders consume parts. Inventory needs to anticipate that consumption, not react to it. A modern MRO platform integrates directly with the EAM and CMMS — pulling planned and unplanned work orders into the demand forecast, pre-staging turnaround kits, and prioritising procurement against the actual work pipeline.
Feed Predictive Maintenance Signals into Spares Demand
For operators running mature predictive maintenance programmes, IIoT, vibration, thermal, and SCADA telemetry provide early signals of impending asset failure. A modern MRO system uses those signals to pre-position the right spares before failure becomes a stockout — transitioning MRO inventory from reactive emergency procurement to genuinely predictive replenishment.
The KPIs That Matter
Without measurement, none of this can be managed. The operators who run inventory well track a small, disciplined set of metrics across three functional axes – inventory itself, the maintenance work it supports, and the procurement engine that replenishes it.
The asset itself
- Inventory turnover ratio
- Stock availability rate
- Fill rate
- Service level (target vs actual)
- Inventory accuracy (book vs physical)
- Carrying cost as % of value
What it enables
- MTTR (Mean Time to Repair)
- Equipment uptime
- Stockout incidents per period
- Spare-availability rate
- Schedule attainment
- Emergency work-order rate
What replenishes it
- Supplier lead time (actual vs quoted)
- Procurement cycle time
- Purchase price variance (PPV)
- Supplier on-time delivery
- Emergency procurement spend
- Spend under contract
The trap most operators fall into is reporting these in isolation. Inventory turnover looks great until you discover the dead stock that wasn’t moving is being written off rather than counted in the denominator.
MTTR looks great until you realise the part-availability that’s enabling it is being paid for in 40% surplus carrying cost. The metrics have to be read together, with their trade-offs visible, or the wrong optimisation gets pursued.
Conclusion
MRO inventory in Oil & Gas isn’t a one-dimensional problem. It fans out into a complex operating reality: dozens of inventory categories, spare parts classification across multiple dimensions, seven core functions, ten end-to-end process steps, and a cross-functional cast that spans maintenance, reliability, operations, procurement, supply chain, warehouse, and finance.
The operators who get MRO right are the ones who treat it as a data problem first and a logistics problem second. Deduplicated, attribute-rich spares records. Granular, AI-native criticality scored at the part level — not inherited wholesale from the parent asset. Dynamic demand forecasting that integrates production schedules, planned work orders, and predictive maintenance.
Reorder points that move with real lead times, not static fields nobody has refreshed in three years. Dead stock made visible across plants so inter-plant transfers happen before new POs. And human expertise: planner overrides, engineer corrections, storeroom substitutions: institutionalized through reinforcement learning, rather than walking out the door when individuals retire.
The financial upside is enormous: 15-25% reduction in MRO working capital, elimination of critical-spare stock outs, recovery of seven-figure dead-stock value, and a measurable drop in unplanned downtime tied to spares unavailability.
The operational upside is bigger still, maintenance planners who trust their inventory data, reliability teams who execute turnarounds with the right kits pre-staged, and an asset base that runs closer to its theoretical uptime instead of leaving margin on the table.
The future of inventory management in oil and gas industry — through the energy transition into LNG, hydrogen, CCUS and offshore wind — depends on the same foundation: clean master data, part-level criticality, dynamic forecasting, and warehousing strategies sharp enough to handle a broadening asset base.
This is the direction the industry is moving. The operators that get there first are converting MRO from a quiet cost centre into a measurable source of competitive advantage.
Frequently Asked Questions
What's the biggest cost driver in Oil & Gas MRO inventory?
Unplanned downtime caused by spare-parts unavailability. Industry research consistently shows over half of machine downtime is tied to spares not being on hand at the right site. The secondary driver is working capital tied up in dead stock — typically 20-35% of total MRO inventory value in operators who haven't actively managed it.
How is inventory management in Oil & Gas different from other heavy industries?
Three structural factors set Oil & Gas apart: extreme lead times for offshore and remote sites (often 6-14 weeks, sometimes 40+ weeks for long-lead items), highly technical and non-substitutable parts sourced from single OEMs, and the simultaneous overstocking-plus-understocking paradox driven by inaccurate criticality models that map asset criticality wholesale onto parts.
How many categories of inventory does an Oil & Gas operator typically manage?
Typically 15 distinct categories, organised into four groups: Primary (MRO, Capital, Hydrocarbon), Function-based (Direct Materials, Consumables, Critical Spares, Operational, Safety Stock), Lifecycle (Obsolete, Turnaround, In-Transit, Project), and Ownership-model (VMI, Consignment, Facility). On top of these, every SKU is classified across six dimensions: usage, criticality, movement, value (ABC), lifecycle, and supply risk.
Can AI really replace traditional FMECA criticality assessments?
It doesn't replace them — it augments them. Models like FMECA, VED, and ABC remain valid frameworks. AI adds part-level granularity, integrates first-party ERP, EAM, and CMMS data alongside industry catalogues and OEM documentation, and makes the assessment continuously updated rather than a one-time workshop output. With human-in-the-loop reinforcement, expert judgment is institutionalised rather than lost.
What's the difference between Verdantis MRO360 and a CMMS or EAM?
A CMMS or EAM records and schedules maintenance work. MRO360 optimises the inventory and demand layer that supports it — criticality scoring, dynamic forecasting, reorder logic, dead-stock identification, and predictive-maintenance-driven demand signalling. It integrates back into the CMMS / EAM as a connected system of intelligence, layered on top of existing IT investments rather than replacing them.
How long does it take to deploy an AI-native MRO inventory solution?
Deployment timelines vary by data quality and scope, but plug-and-play, purpose-built platforms like MRO360 are typically deployed in weeks to a few months — a fraction of the multi-year transformation programmes that classical ERP customisation projects require. Master data cleansing through Harmonize can begin in parallel, with measurable results within the first quarter.
What about hydrocarbon inventory — does the same technology apply?
Hydrocarbon inventory accounting is a specialist discipline typically handled by dedicated solutions (Quorum, P2, and others). However, the master data foundation — meters, tanks, pipelines, well classifications — sits in the ERP and benefits directly from Verdantis MDM Suite governance. Clean asset master data is the prerequisite for accurate hydrocarbon accounting, regardless of the accounting platform sitting on top.