


Reliability metrics like MTTF were designed for a simpler industrial era, when supply chains were stable, assets were standardized, and failure consequences were largely confined to maintenance costs. Today’s operations face a fundamentally different risk landscape.
What looks like a minor reliability issue on paper can translate into production stoppage, regulatory exposure, or supply disruption in practice. Leadership decisions therefore require visibility into operational context, not just statistical averages.
A Brief History and the Need for MTTF
For as long as industrial equipment has existed, operators have faced the same fundamental question: when will this fail, and will I have the part ready when it does?
For most of industrial history, the answer was experience, intuition, and tribal knowledge passed from one maintenance engineer to the next.
As industrial systems grew more complex in the mid-20th century, that approach no longer held. Engineers needed a way to quantify reliability, to turn the question of “when will this fail” into something measurable and comparable.
Mean Time to Failure (MTTF) became that number. It provided a simple, standard metric: the average time a component is expected to operate before it fails.
For non-repairable components, this is MTTF; for repairable systems, the equivalent is Mean Time Between Failures (MTBF). The two are closely related and often used interchangeably, though technically distinct.
The elegance of the metric was its simplicity. It transformed an abstract concept, the expected life of a physical component, into a usable number that maintenance engineers, procurement teams, and operations managers could act on.
MTTF did not just shape maintenance schedules. It shaped how an entire generation of engineers thought about assets as objects with predictable lifespans that could be managed through statistical reasoning.
The reason MTTF matters enough to examine carefully is the scale of what is at stake when maintenance planning gets it wrong.
Asset failures are not just a technical inconvenience, they translate directly into lost production, emergency procurement costs, and in some cases safety and environmental incidents.
The numbers below give a sense of the operating environment that MTTF-based decisions are made in.
That framing persists today. Walk into the maintenance planning department of any large industrial operator, an oil refinery, a mining company, a chemical plant, and you will find MTTF and MTBF still at the centre of the conversation.
They appear in reliability-centred maintenance studies, in failure mode and effects analyses, in SAP PM configuration, and in Maximo preventive maintenance schedules.
How MTTF is Calculated, With Worked Examples
At its core, MTTF is the expected value of a component’s failure time distribution. The formal definition is:
In practice, most maintenance teams do not work with this integral directly. They use the simplified version that emerges when you assume a constant failure rate, which is the exponential distribution:
This constant-rate assumption is what makes MTTF straightforward to calculate and use.
Worked Example: Three Components in a Centrifugal Pump
Consider a centrifugal pump in a refinery’s cooling water circuit. A reliability engineer wants to calculate MTTF for three key components and use those numbers to set preventive maintenance intervals and safety stock levels. Here is how the calculation works in practice:
| Component | Observed Failures | Total Operating Hours | Failure Rate (λ) | MTTF | Suggested PM Interval |
|---|---|---|---|---|---|
| Mechanical Seal | 6 failures | 12,000 hours | 0.0005 /hr | 2,000 hours (~12 months) | Replace at 1,600 hours |
| Bearing (radial) | 3 failures | 18,000 hours | 0.000167 /hr | 6,000 hours (~36 months) | Inspect at 4,500 hours |
| Impeller | 1 failure | 15,000 hours | 0.0000667 /hr | 15,000 hours (~7 years) | Inspect at major overhaul |
The mechancial seal’s MTTF of 2,000 hours tells the storeroom to keep at least one spare seal in stock at all times. The bearing’s 6,000-hour MTTF suggests a lower stocking priority.
The impeller’s 15,000-hour MTTF makes it an order-on-demand part for most operations. This is MTTF doing exactly what it was designed to do, and doing it well.
The simple calculation above assumes failures occur at a constant rate throughout the component’s life. In reality, most components follow a pattern known as the bathtub curve: higher failure rates when new (infant mortality from installation errors), a stable middle period, and rising failure rates as the component ages and wears out.
The Weibull distribution captures this reality. Its shape parameter β tells you which part of the curve a component is in:
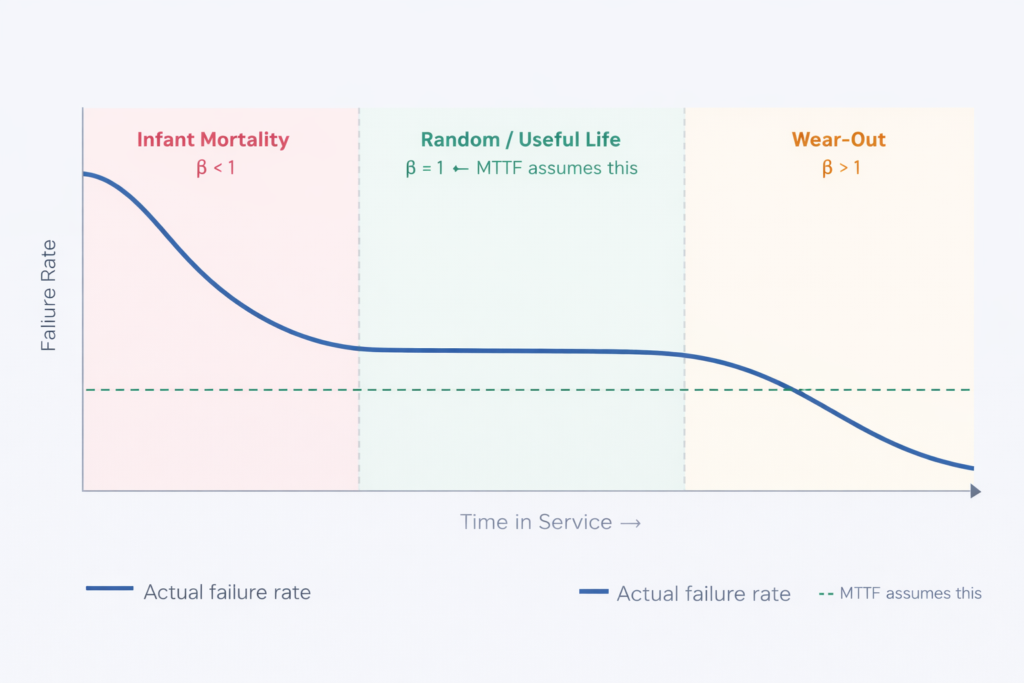
Most EAM platforms assume a constant failure rate (β = 1, dashed green line). Real industrial assets in the wear-out phase have β > 1, meaning MTTF systematically underestimates risk as equipment ages. (Source: Reliability Magazine)
| β Value | Lifecycle Phase | What It Means for the Pump Seal Example |
|---|---|---|
| β < 1 | Infant Mortality | The seal fails shortly after installation. Likely cause: incorrect fitting, wrong grade specified. Standard MTTF calculation based on this data will underestimate normal operational life. |
| β = 1 | Random / Useful Life | Failures occur at a constant, unpredictable rate. MTTF is a valid planning tool here. This is the only phase where the standard MTTF assumption is mathematically sound. |
| β > 1 | Wear-Out | The seal is ageing and failure rate is rising. A PM interval set at 80% of MTTF based on early-life data will now be too long, and failures will occur before the scheduled replacement. |
Most EAM platforms default to exponential distributions (β = 1). For ageing industrial assets, β > 1 is common, making static MTTF unreliable.
A NASA study of 30 identical bearings run to failure under controlled conditions, cited in Reliability Magazine, found variance so high that standard MTTF-based changeout schedules became statistically indefensible.
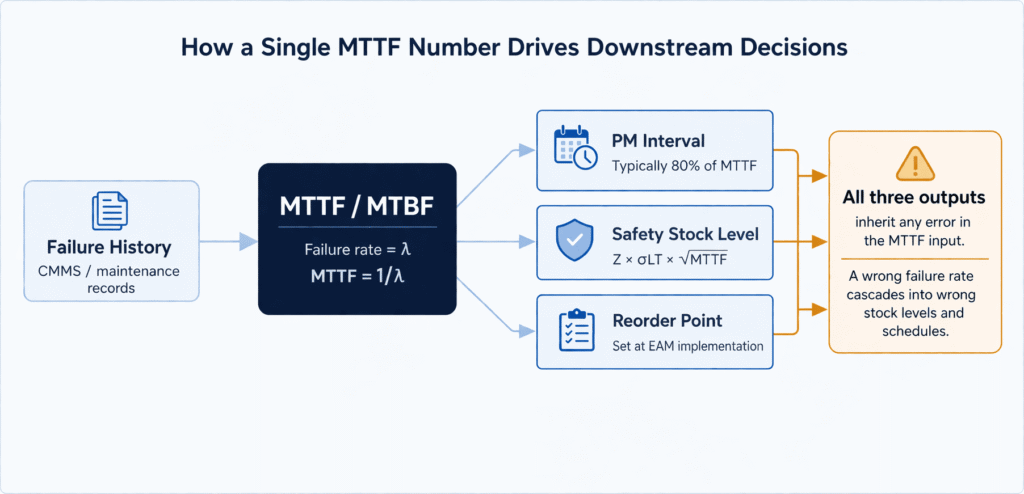
The link between MTTF and inventory planning is direct. Most ERP systems calculate safety stock using a formula derived from the failure rate:
For the pump seal in our example: if MTTF is 2,000 hours, the target service level is 95% (Z = 1.65), and the lead time for the seal from its supplier has a standard deviation of 2 weeks, the safety stock calculation will produce a specific units-to-hold recommendation.
Crucially, if the MTTF input is wrong, because it was calculated from a heterogeneous population or under different operating conditions, every downstream inventory decision is wrong by the same margin.
MTTF's Role in Maintenance and MRO Inventory
Before exploring the limitations, it is worth being direct about what MTTF gets right, because the temptation in technology discourse is to discard the old in favour of the new. That would be a mistake here.
Human beings are poor judges of failure probability over time. We overestimate the reliability of equipment we have recently serviced and underestimate the degradation of equipment that has been running quietly.
MTTF forces organisations to replace intuition with calculation. A pump with an MTTF of 18 months does not care whether the maintenance engineer believes it looks fine. The statistic is not an opinion.
Maintenance engineers, procurement teams, operations managers, and finance directors all need to talk about asset risk. MTTF gives them a common vocabulary.
Its standardisation in ISO 14224, MIL-HDBK-217, and IEC 60812 means a reliability engineer moving between industries does not need to learn a new framework.
Without some estimate of expected failure life, PM scheduling is either over-conservative, replacing parts with significant remaining life, or under-conservative, waiting until components fail.
MTTF provides the rational anchor. A radial bearing with a 6,000-hour MTTF should be inspected at 4,500 hours, not at 3,000 (wasteful) and not at 8,000 (risky).
The pump seal that fails every 2,000 hours on a fleet of ten pumps generates a predictable annual demand for seals. That demand estimate, however imperfect, is the foundation of the storeroom’s replenishment logic.
Every spare parts criticality assessment ultimately sits on top of some version of this failure-rate-to-demand translation.
MTTF is not wrong. It is incomplete. The distinction matters enormously when deciding what to build next.
Who Owns MTTF in Industrial Operations
Unlike FMEA, which has a clearly defined cross-functional ownership structure, MTTF tends to be owned in fragments across the organisation.
Understanding where it lives, and where it does not, helps explain why its limitations often go unaddressed.
Reliability Engineering
Calculates MTTF from failure history data in the CMMS, sets PM intervals, and is typically the only function that understands the statistical assumptions behind the number. Often the sole custodian of whether the Weibull β assumption is valid for a given asset.
Maintenance Planning & MRO Procurement
Uses MTTF-derived demand estimates to set reorder points and safety stock levels in the ERP. Rarely questions the quality of the MTTF input, and has limited visibility into whether the failure rate used is still valid for current operating conditions.
Operations / Plant Management
Bears the consequence of MTTF being wrong, in the form of either unplanned downtime or excessive maintenance cost. Provides the production context (how critical is this asset today, what is it actually running at) that MTTF calculations rarely incorporate.
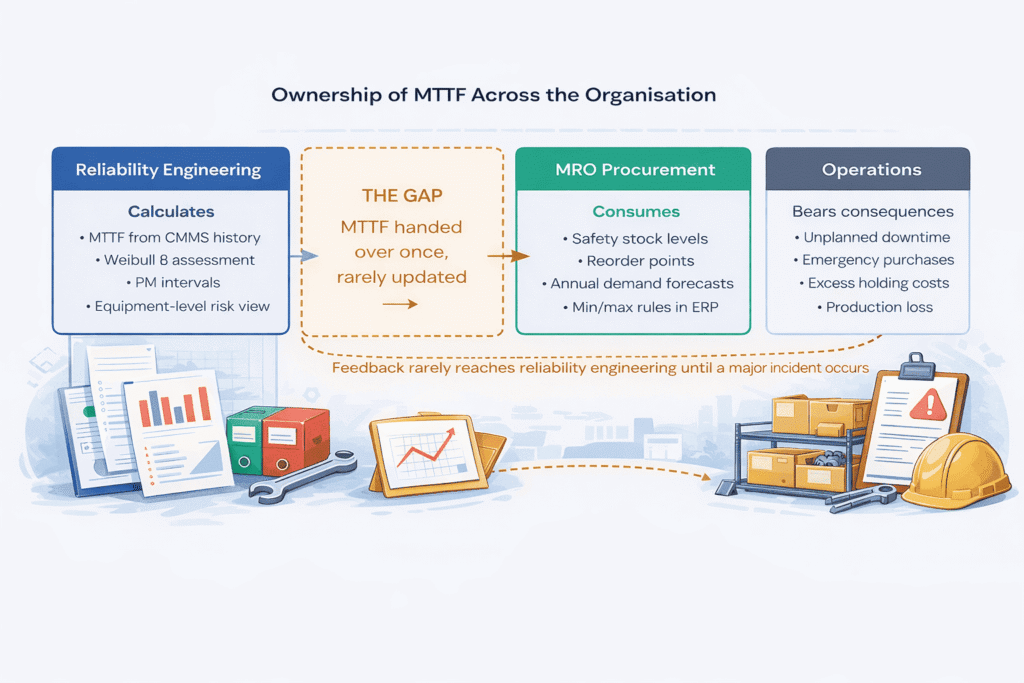
In most industrial organisations, the person who calculates the MTTF (reliability engineering) and the person who uses it to make inventory decisions (MRO procurement) work in separate systems, with separate KPIs, and with limited interaction. The failure rate estimate is passed across this gap once, at EAM implementation or during an annual review, and then used until something breaks badly enough to prompt a recalculation. That separation is where a significant proportion of both excess inventory and stockout risk originates.
Where MTTF Structurally Breaks Down
In discussions with clients who extensively use MTTF as their primary planning input, the same limitations surface consistently. These are not theoretical critiques. They are operational failures that show up on production loss reports.
MTTF’s statistical validity rests on a population of identical components operating under identical conditions. That assumption holds in a controlled laboratory. It rarely holds on an industrial site.
In case of two nominally identical centrifugal pumps in the same facility, Pump A runs at 80% of rated capacity on clean water at 20°C. Pump B runs at 110% of rated capacity on mildly corrosive fluid at 35°C.
Their mechanical seals have the same manufacturer part number. Their actual failure distributions are meaningfully different.
A single MTTF calculated from the combined population of both pumps tells you nothing reliable about either one specifically.
Research published in Reliability Magazine makes this point precisely: as organisations improve their reliability practices and begin parsing failure data at the asset-specific level rather than the component-class level, the variance around population MTTF values typically increases rather than decreases, because deeper, asset-specific failure modes become visible that were previously averaged away.
This is exactly why building a criticality programme at the individual asset level, rather than the component-class level, produces meaningfully different results.
Client Case Study
A major Gulf Coast refinery found that its MTTF-based PM schedule was simultaneously over-servicing 40% of its pumps (replacing components with significant remaining life) and under-servicing 23% (missing components that were degrading faster than the population average). The cost of over-servicing was hidden in unnecessary labour and materials. The cost of under-servicing appeared on the production loss report. Neither showed up in the MTTF calculation.
MTTF is calculated from historical data under a specific set of operating conditions. The moment those conditions change, the calculated number begins to drift from reality.
Several variables consistently emerge in reliability engineering literature as the most consequential:
| Variable | Practical Effect on Failure Rate | What MTTF Does With This |
|---|---|---|
| Operating load above rated capacity | Components wear faster; seals and bearings particularly sensitive to overpressure and heat | Not modelled. MTTF calculated at rated load remains unchanged. |
| Ambient and process temperature | The Arrhenius principle shows bearing and insulation life halves with every ~10°C rise above rated temperature | Not modelled. Temperature is not a variable in standard MTTF calculations. |
| Process fluid composition change | A seal rated for neutral-pH fluid degrades significantly faster in acidic or high-viscosity service | Not modelled. The MTTF from neutral-service data continues to be used. |
| Installation and maintenance quality | Post-maintenance infant-mortality failures are common when seals or bearings are reinstalled incorrectly | These early failures skew the population MTTF downward without explaining why. |
| Humidity and corrosive environment | Accelerated surface degradation on mechanical seals and electrical contacts in coastal or humid plant environments | Not modelled unless site-specific failure data is separated from the global population. |
MTTF is calculated from historical failure data. It describes what has happened to a population of components in the past. But a maintenance planner is making decisions about the future: what will fail, when, and what needs to be in stock when it does.
A bearing that is currently vibrating at twice its baseline frequency is not communicating that information to a MTTF calculation.
A transformer running five degrees hotter than normal because of an installation issue six months ago is not reflected in a population-level statistic. By the time the new failure event enters the dataset and updates the MTTF, the damage has already been done.
MTTF tells you when a component is likely to fail. It tells you nothing about whether the replacement part will be available when it does.
This is the most consequential gap, and the one that receives almost no attention in classical reliability engineering literature.
A refinery pump seal has an MTTF of 2,000 hours. The reliability engineer sets a PM interval of 1,600 hours. The procurement team sets a reorder point based on that failure rate. What the model does not know: the seal's only qualified supplier is on a 14-week lead time due to manufacturing constraints. The storeroom runs out. The seal fails at 1,700 hours. The lead time means the pump runs for 6 weeks on a compromised seal before a replacement arrives. The MTTF was right. The system failed anyway.
When MTTF-derived demand estimates are handed to procurement teams, they face a statistical problem that MTTF was never designed to solve.
A critical pump seal consumed once every 14 months does not generate a smooth demand signal. It generates a series of zeros punctuated by occasional ones.
An impeller that sits untouched for three years and then is needed twice in six weeks is not a scheduling anomaly. It is a normal pattern for low-volume, high-criticality spare parts.
Standard forecasting methods, moving averages, exponential smoothing, applied to these intermittent patterns systematically produce the wrong answer.
They over-forecast items with occasional demand spikes and under-forecast items with rare but clustered consumption.
The academic literature on this is well-established: Croston’s method (1972), developed specifically for intermittent demand, showed that standard exponential smoothing is statistically inappropriate for these patterns, and its variants have been validated across RAF inventory data covering more than 11,000 spare parts series.
An asset running on 20-year-old equipment does not simply face the failure risks MTTF captures. It faces a growing risk MTTF has no mechanism to represent: the parts needed to repair it may no longer be manufactured.
MTTF will correctly calculate that a critical valve actuator has a 36-month average service life right up until the day the OEM discontinues the component.
At that point, the storeroom may have three months of stock left, no qualified alternative identified, and a 12-month lead time to source a substitute. The failure risk did not change. The supply risk made the asset unmanageable.
In asset-intensive industries where equipment lifetimes routinely exceed 30 to 40 years, obsolescence is not an edge case. It is a systematic and growing exposure that static reliability metrics are structurally unable to represent.
A standard MTTF analysis does not distinguish between the failure of a $12 gasket that causes a 30-minute delay and the failure of a $4,000 control valve that takes a production unit offline for six days. Both are failures. Both contribute to the MTTF statistic.
But the consequences are not remotely comparable, and a maintenance strategy that treats them as equivalent is systematically misallocating resources, over-investing in preventing low-consequence failures and under-investing in preventing high-consequence ones.
The Cost of Relying on a Static Failure Rate
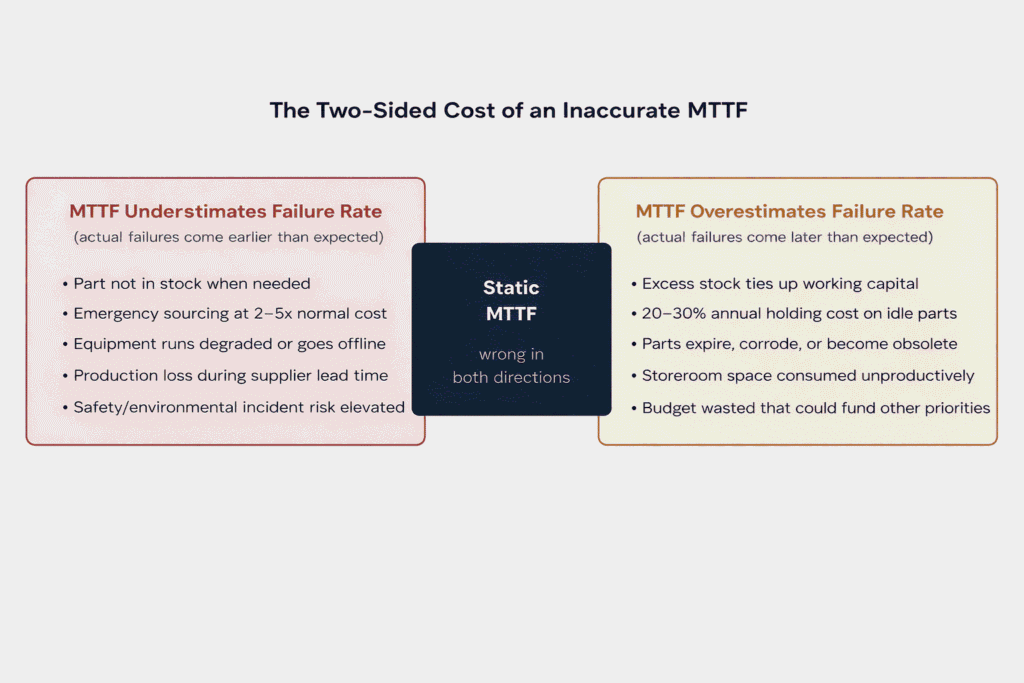
In MRO inventory management, an inaccurate MTTF creates the same two-sided problem that flawed FMEA criticality scores create: simultaneous overstocking and understocking, each costly in different ways.
An asset whose actual failure rate is higher than the MTTF suggests, because operating conditions have changed, because the component is in the wear-out phase, or because the population average obscures site-specific stress, will fail before the planned replacement.
If the part is not in stock and the supplier lead time is weeks rather than days, the result is unplanned downtime.
In oil and gas operations, ABB’s 2025 Value of Reliability survey of 3,600 global decision-makers found that 83% agreed unplanned downtime costs at least $10,000 per hour, with costs reaching $500,000 per hour for major process units.
An asset that is failing less frequently than the population average suggests, because it is running under light load, in a benign environment, or with excellent maintenance quality, will have parts sitting in the storeroom consuming capital.
Every spare part held in inventory carries an annual holding cost estimated at 20 to 30% of its value, covering the capital cost of the stock, storeroom management overhead, and logistics-related expenses.
The practical consequence is a maintenance organisation perpetually fighting on two fronts: scrambling to source critical parts at emergency prices while simultaneously managing a bloated storeroom of parts that will never move. Both problems trace back to the same root cause: a failure rate calculated from historical data, under historical conditions, and not updated as reality changes.
Verdantis’s own research with nearly 1,900 senior executives across Mining, Oil and Energy, Utilities, and Manufacturing found that 51% cited data-quality issues in MRO operations as a primary challenge, and 49% reported inconsistencies in supplier master data.
These are not technology gaps. They are the data discipline failures that make any model, MTTF-based or otherwise, unreliable at the point of decision.
Moving Beyond MTTF: How Modern Asset Management Evolves the Approach
MTTF does not need to be replaced. It needs to be understood for what it is: a starting point, not an endpoint.
The question is what additional context, data, and analytical capability can be layered on top of it to produce decisions that are more accurate, more current, and more complete.
The direction modern enterprise asset management is moving is toward treating failure probability as one variable among many, rather than the primary variable that drives all downstream decisions.
A meaningful criticality model for a spare part asks not just “when does this component fail on average?” but also: what is the production consequence if it fails today? What is the current supplier lead time? Is a qualified substitute available? Has the manufacturer indicated any end-of-life risk on this component? Is there a sister plant that holds stock?
MTTF-only planning asks
Multi-variable criticality asks
This is the practical evolution that tools like the MRO 360 criticality module are built around.
Rather than replacing the MTTF-derived failure probability, they incorporate it as one input into a broader model that also accounts for supplier lead time history, cross-plant stock visibility, production scheduling context, part substitutability, and obsolescence status.
The MTTF foundation remains. What changes is what it feeds into and how frequently all inputs are refreshed.
| Dimension | MTTF-Based Planning | Multi-Variable Criticality |
|---|---|---|
| Update frequency | Set at EAM implementation; updated infrequently | Continuous, re-evaluated as operating conditions change |
| Scope | Population average for a component class | Asset-specific, incorporating individual operating context |
| Variables | Time-to-failure only | Failure probability, supplier lead time, criticality, substitutability, obsolescence status |
| Demand forecasting | Standard exponential smoothing; statistically inappropriate for intermittent MRO demand | Purpose-built intermittent demand methods (Croston and variants) validated on spare parts data |
| Supplier risk | Not in the model | Integrated: lead time history and delivery reliability per part-supplier combination |
| Obsolescence | No mechanism; EOL events are invisible until they cause a stockout | Monitored: manufacturer lifecycle status tracked; substitutes identified proactively |
| Output | PM interval in hours or months | Risk-ranked work queue with financial impact and supply chain status |
Related Methodologies
MTTF is rarely used in isolation by organisations with mature reliability programmes. It sits within a broader ecosystem of analytical frameworks, each approaching the problem of asset failure from a different angle.
| Framework | Approach | Relationship to MTTF |
|---|---|---|
| FMEA / FMECA | Systematic identification of failure modes, their effects, and risk priority scores across components | MTTF feeds into the Occurrence (O) score in FMEA. FMEA provides the failure mode context that makes MTTF more interpretable. |
| Reliability-Centred Maintenance (RCM) | Holistic approach to determining what maintenance tasks are necessary, based on functional failure analysis | RCM uses MTTF as one input to set task intervals. It also asks whether time-based maintenance (MTTF-driven) is even the right strategy for a given failure mode. |
| Fault Tree Analysis (FTA) | Top-down, deductive method that starts with a known failure and traces its root causes | Where MTTF asks “how often does this fail?”, FTA asks “why did this specific failure happen?” They are complementary: MTTF quantifies frequency, FTA explains cause. |
| Risk-Based Inspection (RBI) | Prioritises inspection activities based on consequence and likelihood of equipment failure | RBI uses failure probability (related to MTTF) alongside consequence of failure. Applied primarily to static equipment: pressure vessels, piping, tanks. |
| Reliability, Availability and Maintainability (RAM) | Quantitative analysis modelling how often equipment fails, how quickly it is restored, and its availability for production | MTTF is a direct input to RAM analysis. RAM translates component-level failure rates into system-level availability predictions. |