Las máquinas que parecen funcionar bien suelen estar a punto de averiarse. La mayoría de estos avisos no son visibles, y el análisis de vibraciones los hace visibles.
Una bomba puede sonar sin problemas, un motor puede sonar normal y la producción continúa. Pero un rodamiento dentro de esa máquina puede estar ya desgastándose. Un eje puede estar desalineado o un rotor puede estar desequilibrado. Cuando el personal de mantenimiento detecta estos problemas, es posible que el fallo ya se haya producido. El análisis de vibraciones, en cambio, puede detectar un fallo en un rodamiento seis semanas antes, identificar un eje desalineado antes de que se produzcan daños en un acoplamiento y un rotor desequilibrado antes de que pueda acabar con toda la caja de cambios.
Cada activo giratorio produce una firma de vibración que refleja cómo se comporta internamente la máquina. Cuando algo cambia dentro de esa máquina, el patrón de vibración cambia primero, mucho antes de que se produzca una avería, mucho antes de que se produzca una parada y semanas antes de que aparezcan síntomas visibles.
El análisis de vibraciones es la disciplina que capta estos cambios y los interpreta correctamente. De este modo, los equipos de mantenimiento pasan de reaccionar ante los fallos a detectarlos a tiempo. En los sectores con muchos activos, el análisis de vibraciones funciona bien cuando se combina con datos maestros y de MRO limpios y controlados. Puede ayudar a reducir el tiempo de inactividad hasta en 60%.
En esta guía, vamos a entender en detalle el análisis de vibraciones.
¿Qué es el análisis de vibraciones?
El análisis de vibraciones mide cómo vibra una máquina y utiliza los datos para comprender lo que ocurre en su interior. Se trata de un proceso de diagnóstico que convierte el movimiento de la máquina en información útil que los equipos pueden utilizar para detectar, controlar y prevenir fallos antes de que se produzcan. Los datos del sector sugieren que el análisis de vibraciones puede identificar 90% de las posibles causas de avería en los equipos rotativos.
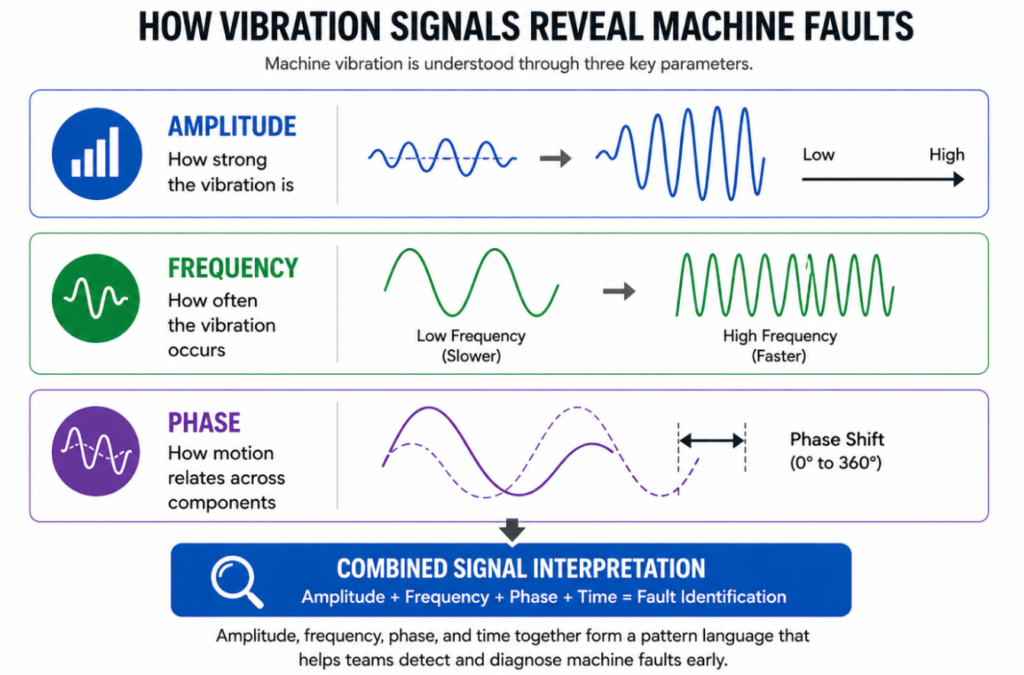
Las vibraciones inducidas por cada pieza móvil de cada máquina no son aleatorias, sino que siempre tienen patrones regulares. En el análisis de vibraciones, los sensores recogen el movimiento y la señal se procesa en función de tres parámetros:
- Amplitud: Muestra la intensidad de la vibración. Un aumento de la amplitud puede indicar que algo está empeorando dentro de esa máquina.
- Frecuencia: Muestra la frecuencia con la que se produce la vibración. Un pico de frecuencia específico puede apuntar directamente a un fallo o desequilibrio del rodamiento.
- Fase: Muestra la relación entre diferentes puntos de vibración. Un desplazamiento de fase entre dos puntos puede deberse a una desalineación a través de un acoplamiento.
Las señales de vibración de una máquina en funcionamiento se adquieren como una forma de onda temporal o se transforman en un espectro de frecuencias utilizando métodos como la FFT. Este método descompone la señal en componentes de frecuencia, y la identificación de esos componentes de frecuencia individuales le informará de algo diferente sobre el estado de la máquina.
¿Cuándo añadir el análisis de fases?
Los análisis de amplitud y frecuencia te dicen que algo va mal y te señalan el componente que no funciona correctamente. La fase te dice cómo funciona internamente el sistema.
La fase describe la relación temporal entre las señales de vibración. No se pregunta cómo de fuerte es una vibración o con qué frecuencia se produce, sino que muestra cómo se mueven diferentes partes de la máquina relacionadas entre sí. En ocasiones, dos puntos de una máquina pueden moverse al unísono, pueden moverse en direcciones opuestas o pueden moverse con un desfase entre ellos. Esto se calcula como un ángulo de 0° a 360°.
Algunos fallos pueden parecer similares en el espectro. Por ejemplo:
- El desequilibrio y la desalineación pueden producir picos de frecuencia similares.
- La holgura y los problemas estructurales pueden crear niveles de vibración similares.
El análisis de fases ayuda a separarlos. Muestra cómo el movimiento viaja a través de la máquina, por lo que podemos entender:
- Si los componentes se mueven en sincronía
- Si las transferencias de energía a través de acoplamientos
- Si las estructuras reaccionan de forma diferente bajo carga
En realidad, la amplitud, la frecuencia, la fase y el tiempo transmiten colectivamente un lenguaje de patrones que el personal de mantenimiento utiliza para identificar problemas. En la tabla siguiente se muestra cómo se manifiestan los tipos de avería típicos en forma de señales de vibración:
| Tipo de avería | Qué amplitud muestra | Qué frecuencia muestra | Qué fase muestra | Qué tiempo/forma de onda muestra |
|---|---|---|---|---|
| Desalineación del eje | Elevada vibración en el lado del acoplamiento; mayor vibración axial. | Fuertes armónicos (2×, 3×) y bandas laterales en torno a la velocidad de marcha. | Desplazamiento de fase entre los puntos del lado de acoplamiento; cambia cuando se desalinea. | Impulsos modulados o similares a impactos bajo carga. |
| Juntas mecánicas flojas | Lecturas no repetibles; la vibración puede aumentar, pero no siempre. | Ruido de banda ancha con múltiples armónicos. | La fase varía según los puntos de conexión; una estructura estable tiene una fase constante. | Picos irregulares y nerviosos o parloteo. |
| Desequilibrio | Pico fuerte y estable a velocidad de carrera (1×). | Energía dominante a velocidad de marcha, bandas laterales mínimas. | Relación de fase predecible en todas las direcciones y puntos de medición. | Forma de onda sinusoidal suave y repetitiva. |
Diagnóstico con análisis de vibraciones
El análisis básico de vibraciones indica que algo va mal, mientras que el diagnóstico avanzado explica por qué va mal y cómo se desarrolla el fallo. A este nivel, no te limitas a leer picos; analizas cómo se comporta la energía en todo el sistema.
Armónicos y bandas laterales
Los armónicos son múltiplos de una frecuencia base. Si una máquina funciona a cierta velocidad, es posible que se observen múltiplos 1x, 2x, 3x, 4x. Por ejemplo, la desalineación suele producir patrones armónicos fuertes, y la holgura crea múltiples armónicos con amplitudes inestables.
Las bandas laterales aparecen como picos más pequeños alrededor de una frecuencia primaria. Indican efectos de modulación como desgaste de los engranajes, variación de la carga o rotación excéntrica.
Resonancia y diagnóstico erróneo
Toda estructura tiene una frecuencia natural. Cuando la máquina funciona cerca de esa frecuencia, la vibración puede amplificarse significativamente, provocando resonancia. Esto crea un problema porque los niveles de vibración aumentan bruscamente, pero no habrá ningún fallo real en la fuente.
La resonancia puede hacer que un problema menor parezca grave o enmascarar la causa real de la vibración. Por tanto, una amplitud elevada no siempre significa una gravedad elevada. La interpretación debe tener en cuenta la dinámica del sistema. La validación cuidadosa antes de actuar es crucial.
Análisis de formas de onda y órbitas
La forma de onda muestra cómo evolucionan las vibraciones con el tiempo, y el análisis orbital muestra la trayectoria del movimiento del eje. Estos análisis revelan impactos, inestabilidad y patrones de movimiento irregulares.
Cuando hay un funcionamiento estable, la forma de onda puede ser suave, y cuando hay impactos o holguras, la forma de onda se distorsiona. Los patrones orbitales muestran el comportamiento del eje que los datos de frecuencia por sí solos no pueden mostrar, sobre todo en sistemas rotativos de movimientos complejos.
Resolución, promediado y claridad de los datos
Los pequeños cambios en la configuración del procesamiento de datos pueden afectar a la interpretación:
- La resolución de frecuencia determina el grado de detalle del espectro
- El promediado suaviza el ruido pero puede ocultar agujeros transitorios
- La selección del ancho de banda afecta a los fallos visibles
Cuando la resolución es baja, las frecuencias muy próximas entre sí se fusionan y las averías resultan indistinguibles. Si el promediado es demasiado agresivo, las primeras señales de fallo pueden desaparecer.
El análisis básico detecta anomalías. En condiciones reales, pueden existir varios fallos juntos.
Las señales pueden solaparse y las condiciones de funcionamiento pueden variar. Los diagnósticos avanzados validan y aíslan el fallo, de modo que las averías se identifican con mayor confianza, impulsando acciones precisas.
Ni siquiera el análisis de espectro más sofisticado puede ofrecer un retorno de la inversión si los datos de las piezas de recambio son confusos. Los materiales duplicados, la falta de especificaciones y una criticidad poco clara desdibujan la línea entre supervisar y sustituir ahora. El gobierno de datos de Verdantis MRO garantiza que cada alerta basada en vibraciones esté vinculada a registros de piezas precisos y limpios, de modo que los equipos de mantenimiento puedan priorizar las acciones en función del impacto, el coste y la disponibilidad.
Por qué es importante el análisis de vibraciones en el mantenimiento
Según la 2025 Informe sobre el estado del mantenimiento industrialLas 500 mayores empresas manufactureras pierden hasta $1,4 billones al año debido a paradas imprevistas.
La maquinaria sufre una avería, lo que lleva al equipo a realizar reparaciones e instalar nuevos componentes antes de reanudar las operaciones. El mismo problema se repite al cabo de unas semanas. El proceso sigue sucediendo de esta manera. El mantenimiento reactivo crea este tipo de situaciones de mantenimiento. Los problemas de mantenimiento existen porque las personas no pueden ver lo que requiere su atención.
El mantenimiento preventivo, en cambio, sustituye las piezas según lo previsto, lo necesiten o no. El calendario no recoge todas las condiciones de la máquina porque sólo muestra los intervalos de mantenimiento previstos.
El análisis de vibraciones contribuye al mantenimiento predictivo gracias a su capacidad para mostrar las condiciones de la máquina en distintos estados operativos. El equipo funciona utilizando los datos de funcionamiento de la máquina en lugar de basarse en el tiempo o en intervalos de tiempo preestablecidos. Las señales de vibración muestran el estado de funcionamiento actual de la máquina, lo que permite detectar problemas mecánicos mediante la identificación de diferentes patrones de desgaste, desalineación y condiciones no válidas.
El rodamiento permanecerá en uso hasta que alcance un límite de tiempo específico, que determina su calendario de sustitución. El componente de la máquina sólo debe sustituirse cuando su patrón de vibración indique signos de daños.
El análisis de vibraciones emplea los datos actuales de funcionamiento de la máquina para predecir los fallos del equipo tras compararlos con los datos registrados anteriormente. Los equipos de mantenimiento pueden alcanzar tres objetivos, que incluyen la disminución del tiempo de inactividad no planificado, la mejora de la fiabilidad de los activos y la programación de las actividades de sustitución durante el tiempo operativo.
El análisis de vibraciones a nivel operativo ayuda a las empresas a reducir los tiempos de inactividad imprevistos y los gastos de mantenimiento, al tiempo que prolonga la vida útil de los equipos y aumenta la fiabilidad operativa. El mantenimiento predictivo permite a las empresas planificar sus tiempos de inactividad y determinar la distribución de la mano de obra y los costes de mantenimiento. adquisición de piezas de recambio necesidades.
¿Qué es la prueba de vibraciones frente a la monitorización?
Ambas utilizan las mismas fuentes de datos, pero sus tiempos operativos difieren y sus requisitos de uso de datos son distintos.
Pruebas de vibración: Evaluación puntual
El estado actual del activo muestra su estado operativo actual. La prueba establece el estado actual respondiendo a la pregunta: "¿Qué está pasando ahora mismo?".
Un técnico sigue una ruta definida y se detiene en determinadas máquinas. Utilizan un sensor para medir la vibración de la máquina desde diversas partes del equipo. La lectura muestra el estado de funcionamiento actual de la máquina.
Control de vibraciones: Seguimiento continuo
La monitorización de vibraciones hace un seguimiento del estado de los activos durante todo su periodo operativo, ya que realiza un seguimiento continuo de las actividades de la máquina. Proporciona actualizaciones de estado continuas que muestran los cambios operativos actuales mediante instalaciones de sensores permanentes, que permiten la recopilación de datos en tiempo real. Los sistemas modernos utilizan la monitorización continua de vibraciones para detectar patrones de vibración inusuales que se convierten en problemas de rendimiento importantes.
He aquí una rápida comparación entre las pruebas de vibración y la monitorización de vibraciones:
| Factor | Pruebas de vibración | Control de vibraciones |
|---|---|---|
| Recogida de datos | Tomar lecturas manualmente a intervalos fijos utilizando dispositivos portátiles en las rutas de inspección. | Montar sensores de forma permanente y capturar continuamente datos de vibración en tiempo real |
| Visibilidad del estado de los activos | Instantánea del comportamiento de la máquina en el momento de la medición | Visión continua del comportamiento de la máquina a lo largo del tiempo |
| Detección de fallos | Identifica fallos en desarrollo si se hace un seguimiento de las tendencias. Pasa por alto fallos rápidos entre inspecciones. | Detecta los cambios graduales y repentinos a medida que se producen |
| Continuidad de los datos | Existen lagunas entre las lecturas | Captura continua de datos en tiempo real para un seguimiento fiable de las tendencias |
| Coste y configuración | Menor coste | Mayor coste debido a los sensores, la infraestructura y las necesidades de integración |
| Más adecuado para | Activos no críticos | Activos críticos |
Fallos comunes de las máquinas que detecta el análisis de vibraciones
Las máquinas siguen patrones de fallo específicos que los técnicos pueden anticipar. Cada tipo de fallo distinto genera un patrón de vibración único que produce resultados idénticos. La señal manifiesta estos elementos a través de distintos picos de frecuencia, patrones armónicos y actividad de señal de alta frecuencia. Algunos de los fallos de las máquinas que el análisis de vibraciones puede sacar a la superficie son:
| Tipo de avería | Cómo aparece en los datos de vibraciones | Qué indica | Acción recomendada |
|---|---|---|---|
| Desequilibrio | Un pico dominante a velocidad de carrera (1× frecuencia), normalmente estable y constante en todas las lecturas. | La distribución desigual de la masa en los componentes giratorios provoca una fuerza centrífuga durante el funcionamiento. | Realice el equilibrado dinámico para restablecer la distribución uniforme de la masa. |
| Desalineación | Presencia de frecuencias armónicas (2×, 3×) y aumento de los niveles de vibración axial | Los ejes no están bien alineados, lo que provoca una transferencia desigual de la carga entre los acoplamientos. | Realinear los ejes y verificar la alineación del acoplamiento en condiciones de funcionamiento. |
| Soltura mecánica | Múltiples armónicos con amplitud irregular y patrones de onda distorsionados | Inestabilidad estructural debida a pernos sueltos, fijaciones o soportes degradados. | Apriete, repare o sustituya los componentes estructurales afectados. |
| Desgaste de rodamientos | Aumento de los niveles de vibración y aceleración de alta frecuencia, a menudo con frecuencias de fallo específicas. | Daños iniciales, como picaduras, desconchados o fallos de lubricación en el interior de los rodamientos. | Inspeccione y sustituya los rodamientos antes de que el fallo progrese. |
| Defectos del engranaje | Bandas laterales en torno a la frecuencia de engranaje y patrones de modulación en el espectro | Desgaste de los dientes de los engranajes, daños o distribución desigual de la carga en los sistemas de engranajes. | Inspeccionar los dientes y la alineación de los engranajes, y reparar o sustituir los componentes dañados. |
¿Cómo recoge el análisis de vibraciones las lecturas de vibraciones sobre el terreno?
El análisis de las vibraciones empieza en el campo, no en una pantalla. Si la lectura es errónea en ese punto, todo lo anclado a ese punto se viene abajo.
La mayoría de las plantas recurren a la recogida basada en rutas. Un técnico sigue una ruta predeterminada y recopila datos en puntos fijos: motor intraborda, motor fueraborda, bomba intraborda, bomba fueraborda. Esa repetición es lo que hace que los datos sean interesantes. Si se cambia el punto o la dirección, ya no se compara correctamente.
La colocación del sensor también es un gran problema. Aunque tengas un buen sensor, si lo colocas en la superficie equivocada, obtendrás datos inútiles. Los grados de libertad deben medirse en puntos sólidos y estables, como alojamientos de rodamientos o a lo largo de la trayectoria de la carga, no donde se desplaza realmente la vibración.
También existe el deseo de ir rápido. Poner el sensor, hacer la medición, seguir adelante. En realidad, la señal debe estabilizarse durante unos segundos. Si te precipitas, lo único que acabas captando es el ruido transitorio.
La mayoría de los datos erróneos se generan por estos pequeños compromisos: el punto de adquisición se desplaza ligeramente, el contacto no es tan bueno o se capturan las lecturas demasiado rápido. Los equipos suelen darse cuenta más tarde, cuando el espectro tiene un aspecto inusual y no reconocen el patrón. Si es así, lo mejor que pueden hacer es volver atrás y tomar de nuevo la lectura.
La investigación de Verdantis muestra que la mejora de la calidad de los datos de piezas de repuesto puede reducir los tiempos de inactividad imprevistos hasta en 50% y recortar los costes de inventario y aprovisionamiento de MRO entre 20 y 30%. Cuando las alertas basadas en vibraciones se superponen a unos datos de MRO limpios y controlados, las empresas pueden pasar del almacenamiento "por si acaso" a las intervenciones "justo a tiempo".
Equipos de análisis de vibraciones: Herramientas y ventajas y desventajas
El análisis de vibraciones depende de los datos, y la calidad y frecuencia de esos datos dependen del equipo utilizado para recogerlos. Las máquinas portátiles son utilizadas por un técnico que recorre una ruta predefinida, recogiendo lecturas manualmente. Los sistemas de monitorización continua de vibraciones en línea instalan sensores de forma permanente en lugares específicos y ofrecen visibilidad en tiempo real con seguimiento continuo de tendencias y análisis automatizados.
He aquí una comparación entre ambos enfoques:
| Factor | Herramientas manuales de vibración | Sistemas de vigilancia en línea | Contrapartidas a tener en cuenta |
|---|---|---|---|
| Enfoque de la recogida de datos | Las mediciones se realizan manualmente a intervalos programados durante las rutas de inspección. | Los sensores captan y transmiten continuamente datos de vibración sin intervención manual | La recogida manual reduce los costes, pero depende de la coherencia y la puntualidad de los técnicos. |
| Frecuencia de los datos | Limitación de la frecuencia de inspección (diaria, semanal o mensual) | Recogida continua de datos en tiempo real | La menor frecuencia de los datos reduce la visibilidad de los fallos de rápida evolución |
| Profundidad de conocimiento | Proporciona información basada en tendencias, pero puede pasar por alto anomalías de corta duración. | Captura el comportamiento completo, incluidos los fallos transitorios y de desarrollo rápido. | Un conocimiento más profundo requiere una mayor inversión y complejidad del sistema |
| Velocidad de detección | Los fallos sólo se detectan durante las inspecciones programadas | Los fallos se detectan en cuanto se produce un comportamiento anómalo | Una detección más rápida mejora el tiempo de respuesta, pero aumenta el coste del sistema y el volumen de datos |
| Coste de aplicación | Menor coste inicial y mínima infraestructura necesaria | Mayor coste inicial debido a los sensores, la conectividad y los sistemas de integración | Un coste menor limita la capacidad; un coste mayor requiere una clara justificación del ROI |
| Escalabilidad | Fácil de implantar en muchos activos con una configuración mínima | Normalmente se despliega en activos críticos seleccionados debido a consideraciones de coste | Amplia cobertura frente a supervisión en profundidad, raramente ambas a escala sin compensaciones |
| Dependencia operativa | Depende de la habilidad del técnico, la disciplina y la consistencia de la ruta | Menos dependiente de la intervención manual una vez instalado | La menor dependencia humana mejora la coherencia pero reduce la flexibilidad |
| Mejor caso de uso | Supervisión del estado general de una amplia base de activos | Equipos críticos o de alto riesgo que requieren una visibilidad continua | La mayoría de las plantas combinan ambos enfoques para equilibrar costes y riesgos |
Aunque las herramientas manuales son excelentes para las comprobaciones basadas en rutas, la supervisión continua genera enormes volúmenes de datos. Las plataformas impulsadas por IA de Verdantis ayudan a los equipos a gestionar este diluvio de datos normalizando, clasificando y correlacionando las señales de vibración con historiales de activos, órdenes de trabajo y Inventarios MROpara que los analistas se centren en las alertas validadas y no en el ruido de los datos.
Cómo funcionan la supervisión y el análisis de vibraciones
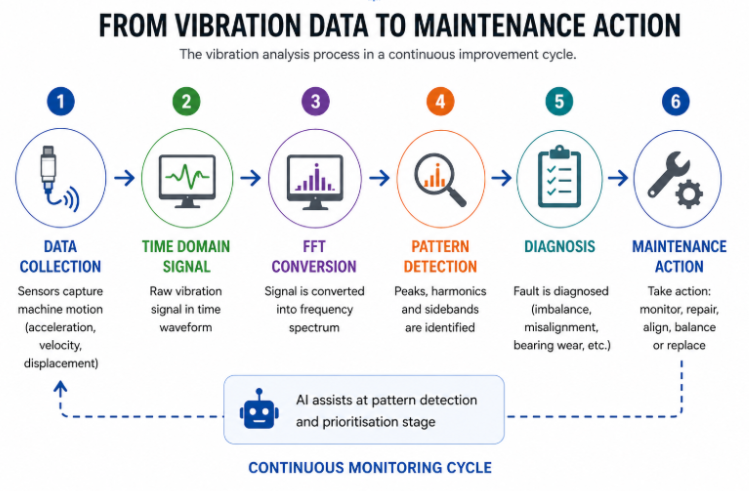
Las máquinas funcionan desplazando sus elementos mediante un movimiento continuo. El funcionamiento continuo de la máquina produce vibraciones que se transforman en datos a través de una secuencia de procesos. El proceso de análisis de vibraciones comienza con estos pasos específicos:
Recogida de datos
El activo requiere la instalación de sensores en los puntos de los rodamientos, los ejes y las carcasas a través de los cuales debe ser monitorizado. El sistema comienza a realizar un seguimiento de las vibraciones de la máquina a partir de su estado operativo. Las lecturas de los sensores muestran el movimiento a lo largo del tiempo, que se mide como aceleración, velocidad o desplazamiento. Estos datos representan la etapa inicial del proceso de señalización.
Señales en el dominio del tiempo
La primera vista muestra una forma de onda en el dominio del tiempo. Las ondas de baja frecuencia muestran cómo cambia la intensidad de las vibraciones a lo largo del tiempo. Muestra tres tipos de patrones de vibración, que incluyen impactos repentinos, movimientos irregulares e interrupciones inesperadas del sistema. La forma de onda temporal no muestra todo a la vez. Las fuentes de vibración existen en múltiples capas, lo que dificulta la identificación del origen preciso de los problemas del equipo.
Análisis de frecuencias
Es necesaria una forma de onda temporal. Para que el análisis sea completo, la señal en bruto debe procesarse mediante la transformada rápida de Fourier (FFT). El software de análisis transforma la entrada basada en el tiempo en una salida basada en la frecuencia.
La función FFT descompone los datos de sensores complejos en distintos elementos de frecuencia que poseen cada uno sus características específicas de amplitud y fase.
Los fallos mecánicos presentan sus síntomas más comunes en rangos de frecuencia específicos. La maquinaria produce un pico de velocidad de funcionamiento cuando sus componentes experimentan una distribución desigual. La máquina también puede mostrar una alteración de la frecuencia cuando sus componentes se desalinean.
Los equipos de mantenimiento necesitan información clara sobre la distribución de la energía, y la FFT se la muestra.
Interpretación de patrones
El análisis de vibraciones demuestra su poder predictivo mediante la interpretación de patrones, que analiza el espectro de frecuencias. Los analistas buscan patrones específicos, que incluyen:
- Los principales picos que existen en los datos
- Armónicos que muestran patrones recurrentes
- Frecuencias que crean bandas laterales en sus alrededores
Los distintos patrones apuntan directamente a tipos de fallos específicos.
Las máquinas funcionan siguiendo patrones de funcionamiento fijos. Máquinas diferentes muestran patrones de frecuencia idénticos cuando experimentan las mismas averías en lugares distintos. La firma de un activo en buen estado permanece fija durante todo su periodo de funcionamiento. El sistema identifica los fallos a través de los cambios de firma y el seguimiento de los cambios de patrón.
Diagnóstico
El patrón se ha descubierto después de recopilar datos sobre la situación. Los datos funcionan ahora como un recurso procesable. El siguiente paso consiste en vincular el patrón de frecuencia con la configuración de la máquina y las condiciones de funcionamiento para responder a la pregunta: "¿Qué es lo que falla y qué urgencia tiene?".
Los pequeños aumentos de las vibraciones requieren que se vigile la situación hasta que se produzca un desarrollo mayor. Los equipos de mantenimiento necesitan frecuencias de fallo específicas para crear sus programas de mantenimiento. La situación requiere una acción inmediata un rápido aumento de la vibración requiere la sustitución de componentes.
Acción
Los analistas de mantenimiento determinan su ruta de supervisión para el mantenimiento planificado después de que la IA haya completado su análisis de datos, anomalías y detección de patrones. El sistema detecta futuros fallos de los equipos mediante el mantenimiento predictivo, lo que permite a sus operadores crear programas de mantenimiento.
Los equipos de alto rendimiento ejecutan su trabajo mediante flujos de trabajo continuos que siguen una secuencia estructurada de operaciones. El análisis de vibraciones se convierte en una disciplina en la que los equipos se centran en la coherencia de la medición, la recopilación de datos y la calidad. El proceso requiere una validación que confirme la existencia de señales.
El análisis automatizado de vibraciones permite a los equipos mantener un alto rendimiento operativo mediante la detección temprana de fallos, ayudándoles a programar el mantenimiento en función de los resultados analíticos predictivos que dictan los patrones de vibración y las mediciones individuales.
Un análisis predictivo maduro establece un bucle completo entre el análisis de vibraciones y la detección de rotores desalineados, que identifica las piezas MRO afectadas a la vez que realiza un seguimiento de su estado de existencias y de la prioridad del trabajo para ese activo concreto.
Cómo la IA está cambiando la supervisión y el análisis de las vibraciones
Recopilar datos sobre vibraciones ya no es el problema. La mayoría de las instalaciones ya tienen más datos de los que pueden manejar. El verdadero reto es interpretarlos.
Cuando se amplía la supervisión, los datos no sólo aumentan, sino que se entregan en tiempo real. Las lecturas que antes eran un conjunto se convierten en un flujo. En ese momento, incluso para el analista más veterano, la dificultad no es que no pueda leer las señales; es que son tantas que ninguno puede leerlas todas.
Aquí es donde la IA empieza a ayudar de forma práctica. Analiza los datos de vibraciones de varias máquinas, contrasta la situación actual con la normal y pone de relieve cualquier anomalía. En lugar de cribar todos los espectros, pueden concentrarse en los pocos que realmente son diferentes.
Con el tiempo, estos sistemas de IA aprenden a hacerlo mejor. Aprenden cómo funciona cada máquina en la realidad, más que en la teoría. Esto implica menos falsas alarmas y una mayor posibilidad de detectar fallos en una fase temprana, antes de que evolucionen a algo mayor.
La IA no sustituye a los analistas. El sistema puede procesar volúmenes. El analista aplica su juicio para evaluar si se trata de una bandera sensata, verificar el problema y decidir cómo reaccionar.
Verdantis aprovecha modelos de IA entrenados específicamente para automatizar el reconocimiento de patrones y la detección de anomalías a escala. En lugar de revisar manualmente miles de espectros de vibración, los equipos de mantenimiento reciben alertas priorizadas por IA, enriquecidas con contexto MRO, como disponibilidad de piezas de repuesto, plazos de entrega de proveedores e historial de fallos. Así se reducen los falsos positivos y se acelera el paso de la señal a la acción.
Conclusión
El análisis de vibraciones no pretende detener los fallos, pero da visibilidad de los fallos semanas antes. Permite prevenir fallos mediante la correcta interpretación de las señales y la automatización de los activadores de patrones. Así, las decisiones pueden tomarse en tiempo real y las acciones pueden ejecutarse de forma coherente. Un programa avanzado de análisis de vibraciones requiere ejecutar el mismo proceso cada ciclo y utilizar los mismos criterios de un activo a otro, utiliza la IA para la automatización, la coincidencia de patrones y la señalización de anomalías.
Cuando se integran con la gestión de IA de datos MRO, análisis predictivos y flujos de trabajo de mantenimiento de bucle cerrado, los conocimientos sobre vibraciones evolucionan de diagnósticos teóricos a aumentos concretos del tiempo de actividad y ahorros MRO. Vea cómo Verdantis transforma las señales basadas en vibraciones en una estrategia de mantenimiento de activos basada en datos, desde datos MRO limpios hasta flujos de trabajo de mantenimiento basados en IA.
Preguntas más frecuentes (FAQ)
¿En qué se diferencian las alarmas basadas en vibraciones del mantenimiento preventivo basado en el tiempo?
Las alarmas por vibración son alarmas basadas en condiciones: se producen cuando cambia el comportamiento de la máquina, no porque haya expirado un tiempo del calendario. Esto reduce la cantidad de sustituciones innecesarias de piezas que funcionan y, en su lugar, los recursos se gastan en activos que realmente se están degradando. El mantenimiento preventivo basado en el tiempo tiende a pasar por alto fallos tempranos o a cambiar piezas que aún funcionan.
¿Con cuánta antelación suele detectar el análisis de vibraciones un fallo en un rodamiento?
En muchas máquinas rotativas, el análisis de vibraciones puede identificar fallos tempranos en los rodamientos semanas o incluso meses antes de que se produzca un fallo catastrófico, en función de la carga, las condiciones de funcionamiento y la cobertura de los sensores. El plazo específico varía según el tipo de equipo, pero suele oscilar entre 4 y 16 semanas para los rodamientos de bombas y motores.
¿Cómo se decide si utilizar pruebas de vibración o monitorización continua para un activo concreto?
Las pruebas de vibración son útiles para activos no críticos de degradación rápida/lenta cuando el coste y la simplicidad tienen más sentido que el tiempo hasta la detección. Aplique la supervisión continua a activos críticos en los que la detección precoz de fallos bruscos y el seguimiento fiable de tendencias son más importantes que la inversión.