Principales conclusiones
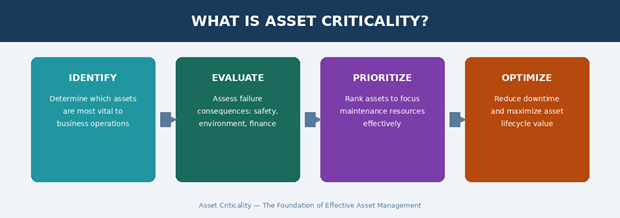
- Criticidad de los activos establece la importancia relativa de cada activo físico evaluando las consecuencias de su fallo para la seguridad, el medio ambiente, las operaciones y las finanzas, lo que proporciona a los equipos de mantenimiento y fiabilidad una base de datos para establecer prioridades.
- Una evaluación estructurada de la criticidad de los activos (ACA) consta de cinco etapas -inventario de activos, definición de criterios, puntuación multifactorial, clasificación por niveles y revisión continua- que dan lugar a un registro ordenado que impulsa estrategias de mantenimiento más inteligentes, decisiones de inversión de capital y gestión de riesgos a lo largo de todo el ciclo de vida de los activos.
- Éxito de los programas de criticidad requieren datos maestros de activos limpios, colaboración interfuncional, integración con sistemas GMAO y ERP, y revisiones periódicas de gobernanza, y el enfoque de Verdantis ofrece todo esto de extremo a extremo: desde la armonización de datos impulsada por IA y la puntuación de criticidad hasta la integración perfecta con SAP, Maximo y EAM.
Lea el artículo completo a continuación para saber más.
La criticidad de los activos es un proceso sistemático de clasificación de los activos físicos -equipos, maquinaria, infraestructuras y sistemas- basado en las posibles consecuencias de su fallo para la seguridad, la producción, el medio ambiente, el cumplimiento de la normativa y el coste.
No todos los activos son iguales. El fallo de un sensor en un compresor de aire tiene consecuencias muy diferentes al fallo de una bomba de refrigeración en un reactor de proceso o al fallo de una válvula en un gasoducto.
El análisis de la criticidad de los activos obliga a las organizaciones a responder a una pregunta fundamental:
"¿Qué pasa si este activo falla y qué impacto tiene ese fallo?".
En las industrias que hacen un uso intensivo de activos, las funciones de mantenimiento, reparación y operaciones (MRO) equilibran constantemente costes, riesgos y fiabilidad. Sin embargo, una de las ineficiencias más persistentes en Gestión de datos MRO y programas tiene su origen en una cuestión sencilla:
| No todos los activos se tratan en función de su verdadera criticidad.
Esto conduce a un mantenimiento excesivo de los equipos no críticos, a un mantenimiento insuficiente de los activos de alto riesgo y a estrategias ineficaces de piezas de repuesto.
Aquí es donde resulta esencial la Evaluación de la Criticidad de los Activos (ACA).
Al evaluar sistemáticamente la importancia de cada activo, las organizaciones pueden priorizar los recursos, mejorar las estrategias de mantenimiento e impulsar resultados empresariales cuantificables.


Industrias que dependen de la criticidad de los activos
Los marcos de criticidad de los activos se utilizan en todos los sectores con gran intensidad de capital en los que los fallos de los equipos tienen importantes consecuencias operativas, financieras o de seguridad.
Personas clave implicadas
La criticidad de los activos es una disciplina interfuncional. Requiere conocimientos operativos, perspicacia financiera, experiencia en seguridad y conocimientos de datos: ninguna persona tiene la visión completa.
Una evaluación eficaz de la criticidad requiere un taller multidisciplinar estructurado. Los sesgos hacia la seguridad o la producción de forma aislada conducen a clasificaciones sistemáticamente incorrectas.
Ninguna persona ve el panorama completo, las seis deben estar en la mesa, con un facilitador neutral que gestione la resolución de conflictos y la calibración.
¿Qué es la evaluación de la criticidad de los activos?
La evaluación de la criticidad de los activos es una metodología estructurada que se utiliza para clasificar los activos en función de las consecuencias de un fallo.
En lugar de tratar a todos los equipos por igual, ACA ayuda a las organizaciones a identificar qué activos tienen el mayor impacto en dimensiones clave como:
Seguridad
Impacto medioambiental
Pérdida de producción
Coste de mantenimiento
Cumplimiento de la normativa
El resultado suele ser una clasificación por niveles (por ejemplo, nivel 1, nivel 2, nivel 3 o crítico, semicrítico, no crítico), lo que permite centrar la toma de decisiones.
El resultado de una evaluación de la criticidad de los activos es un registro clasificado, normalmente en los siguientes niveles Crítico (A / Nivel 1), Semicrítico (B / Nivel 2)y No crítico (C / Nivel 3) - que, a su vez, impulsa las decisiones relativas a la estrategia de mantenimiento, la asignación de capital, el almacenamiento de piezas de repuesto, la frecuencia de las inspecciones y la inversión en mitigación de riesgos.
La criticidad de los activos no es un hecho aislado. Es un programa vivo que debe reevaluarse cuando cambian las configuraciones de la planta, cuando surgen nuevos requisitos reglamentarios o cuando cambian los perfiles de riesgo operativo.
ISO 55000, la norma internacional para la gestión de activos, recomienda explícitamente la evaluación de la criticidad como base para la toma de decisiones sobre el ciclo de vida.
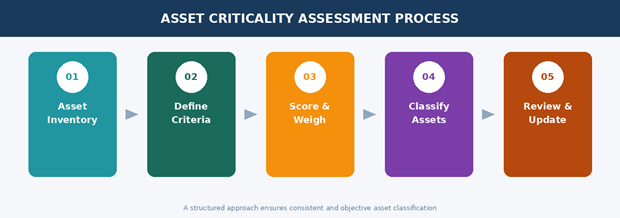
Etapa 1 - Elaborar un inventario completo de activos
Asegúrese de que todos los activos mantenibles se capturan en su sistema con datos precisos y completos. La mala calidad de los datos (duplicados, falta de detalles) dará lugar a resultados de criticidad poco fiables.
Etapa 2 - Definir los criterios de evaluación y la ponderación
Establezca factores de evaluación como la seguridad, el impacto medioambiental, la pérdida de producción, el coste y la redundancia. Asigne ponderaciones en función de las prioridades de la empresa.
Etapa 3 - Puntuación de cada activo
Evalúe los activos utilizando una escala coherente (por ejemplo, 1-5). Combine las puntuaciones con ponderaciones para calcular una puntuación global de criticidad.
Etapa 4 - Clasificación en niveles
Agrupe los activos en categorías como Crítico, Alto, Medio o Bajo para orientar las decisiones de mantenimiento, repuestos e inversión.
Etapa 5 - Revisión y actualización
Actualice periódicamente la criticidad en función de los cambios en las operaciones, el estado de los activos o las prioridades de la empresa.
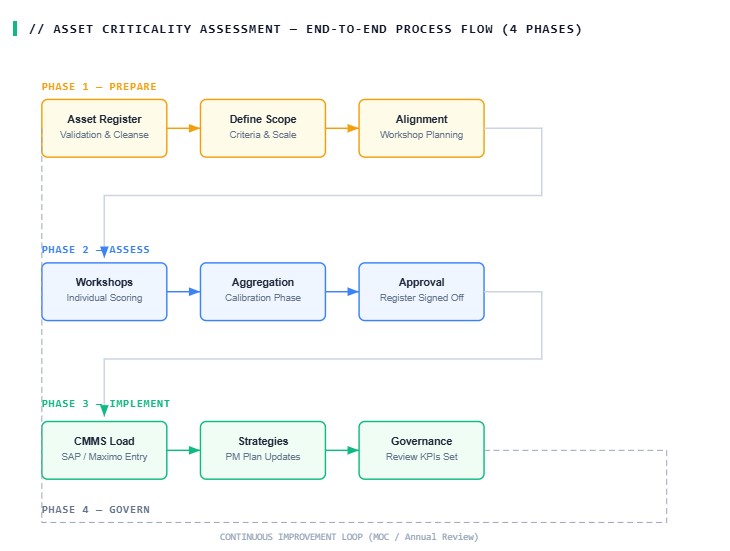
Proceso y flujo de la evaluación
Una evaluación de la criticidad de los activos bien estructurada sigue un proceso definido y repetible. Este es el flujo de principio a fin, desde el inicio hasta la integración en la GMAO y la gobernanza continua.
- Matriz de estrategias de mantenimiento en función de la criticidad
Nivel de criticidad | Rango de puntuación | Enfoque de mantenimiento | Frecuencia de inspección | Política de piezas de recambio |
NIVEL A - CRÍTICO | 4.0 – 5.0 | Análisis predictivo / basado en la condición + RCM. Tolerancia cero con los fallos imprevistos. | Control continuo / en tiempo real | Repuestos de capital in situ, existencias en consignación |
NIVEL B - SEMICRÍTICO | 2.5 – 3.9 | Mantenimiento preventivo con intervalos definidos. Alcance de inspección mejorado. | Mensual / Trimestral | Stock en almacén con punto de pedido |
NIVEL C - NO CRÍTICO | 0 – 2.4 | PM basado en la ejecución hasta el fallo o en el tiempo. Gastos generales de inspección mínimos. | Anual / Según condición | Pedidos a la carta / Aprovisionamiento JIT |
¿Qué es la clasificación de activos críticos?
La clasificación de la criticidad de los activos es el proceso de asignar una puntuación de criticidad a cada activo y utilizarla para crear una lista priorizada de activos.
Mientras que la evaluación define los criterios, la clasificación consiste en aplicar esos criterios a todos los activos para determinar cuáles son los más importantes.
Sin una clasificación clara, las decisiones clave como la planificación del mantenimiento, el almacenamiento de repuestos y la priorización de los pedidos pendientes se vuelven incoherentes y reactivas.
Cálculo de la criticidad de los activos
La criticidad de los activos en las empresas se calcula utilizando un modelo de puntuación basado en el riesgo que combina la probabilidad de que un activo falle con el impacto de ese fallo. La fórmula más utilizada es:
Puntuación de criticidad=Probabilidad de fallo (PdF)×Consecuencia del fracaso (CdF)
- Paso 1: Asignar probabilidad de fallo (PdF)
El PdF se suele puntuar en una escala de 1-5 basado en:
- Historial de fallos (MTBF)
- Edad y estado de los activos
- Entorno operativo
- Eficacia del mantenimiento
Ejemplo de escala:
- 1 = Fallo poco frecuente
- 3 = Fallo ocasional
- 5 = Fallo frecuente
- Paso 2: Calcular la consecuencia del fallo (CdF)
En lugar de un único valor, el CoF suele derivarse de múltiples áreas de impacto:
CdF=S+P+C+E / 4
Dónde:
- S = Impacto en la seguridad
- P = Pérdida de producción
- C = Impacto en los costes
- E = Impacto medioambiental
Cada parámetro se puntúa de 1-5.
Ejemplo 1. Bomba de refinería Bomba de refinería
Factor | Puntuación |
Seguridad (S) | 4 |
Producción (P) | 5 |
Coste (C) | 4 |
Medio ambiente (E) | 3 |
CoF = (4 + 5 + 4 + 3) / 4 = 4,0
Si:
- PdF = 3
Criticidad = 3 × 4 = 12 → Media-alta
MRO Insight: Se requiere un control preventivo y de estado.
- Cálculo basado en FMEA (Avanzado)
Para un análisis más profundo, especialmente en ingeniería de fiabilidad, se utiliza el Número de Prioridad de Riesgo (RPN):
Ejemplo: Caja de engranajes en un sistema transportador
- Gravedad = 9 (interrupción de la producción)
- Ocurrencia = 6 (fallos moderados)
- Detección = 7 (difícil de detectar precozmente)
RPN = 9 × 6 × 7 = 378 → Muy alto
- Modelo de criticidad financiera
Ejemplo: Bomba de alimentación de caldera
- Fallos/año = 3
- Coste por fallo = $50.000
Criticidad = $150.000 de riesgo anual
- Interpretación final (cartografía típica)
Rango de puntuación | Criticidad | Estrategia MRO |
1-5 | Bajo | Run-to-failure |
6-12 | Medio | Mantenimiento preventivo |
13-20 | Alta | Mantenimiento predictivo |
>20 | Extremo | Redundancia + supervisión continua |
En la práctica, las organizaciones utilizan una combinación de estos modelos para garantizar que la criticidad de los activos refleja no sólo el riesgo de fallo, sino también el impacto operativo y financiero, lo que permite una planificación precisa de las operaciones de mantenimiento y reparación y la priorización de los recursos.
Metodología y criterios de puntuación
El método de puntuación ponderada semicuantitativa es el estándar del sector, utilizado en marcos como API 580, ISO 31000 y la Guía de mejores prácticas SMRP. He aquí cómo funciona en la práctica.
- Principales categorías de consecuencias
2 | Impacto medioambiental | Riesgo de vertido, contaminación, incumplimiento de la normativa o daño medioambiental duradero | 15-25% | 1-5 |
3 | Producción | Pérdida de ingresos, reducción del rendimiento o interrupción de servicios críticos sin desvío | 20-30% | 1-5 |
4 | Coste de mantenimiento | Coste directo de reparación o sustitución; mano de obra, piezas y coste de oportunidad perdida. | 10-15% | 1-5 |
5 | Normativa / Cumplimiento | Riesgo de multa reglamentaria, responsabilidad legal o infracción del permiso en caso de incumplimiento | 10-15% | 1-5 |
6 | Reputación / Cliente | Riesgo para la confianza pública, incumplimiento del acuerdo de nivel de servicio con el cliente o exposición a daños para la marca | 5-10% | 1-5 |
- La fórmula de puntuación
					Fórmula estándar de puntuación de criticidad ponderada

Puntuación de criticidad = Σ (Puntuación de categoríai × Pesoti)

Ejemplo: Compresor de inyección de gas - Plataforma en alta mar
Seguridad [5 × 0,35] + Medio ambiente [4 × 0,20] + Producción [5 × 0,25] + Coste [3 × 0,10] + Reglamentación [4 × 0,10]
= 1,75 + 0,80 + 1,25 + 0,30 + 0,40 = 4,50 / 5,00 → CRITICAL TIER A
- La matriz de riesgo 5×5
Cuando la probabilidad de fallo se superpone a la criticidad, los activos se trazan en una matriz de riesgo para determinar la frecuencia de inspección y la selección de la estrategia de mantenimiento:
Análisis de la criticidad de los activos
El análisis de criticidad de activos (ACA) va más allá de la puntuación y la clasificación para ofrecer una inteligencia operativa más profunda. Implica el examen sistemático de los datos de criticidad, tanto individualmente como entre poblaciones de activos, para identificar patrones, puntos críticos de fallo, oportunidades de optimización del mantenimiento y concentraciones de riesgo.
Un análisis eficaz transforma las puntuaciones brutas de criticidad en información estratégica que sirve de base a los planes de gestión de activos, los presupuestos de capital y los registros de riesgos. Es el motor analítico que conecta los resultados de la evaluación de la criticidad con las decisiones empresariales.
Consideraciones avanzadas sobre la criticidad de los activos
Fallos ocultos: Algunos activos (como las válvulas de seguridad o los sistemas de reserva) pueden fallar sin signos visibles, pero con graves consecuencias. Suelen considerarse muy críticos y requieren pruebas periódicas.
Análisis de cuellos de botella: Incluso los activos poco críticos pueden convertirse en críticos si actúan como una limitación en el proceso de producción.
Criticidad dinámica: La criticidad de los activos no es fija: cambia en función de las condiciones de funcionamiento, el estado de los activos, las prioridades de producción y la disponibilidad de redundancia.
Integración digital: La integración de ACA con CMMS, EAM y herramientas predictivas permite actualizaciones en tiempo real, priorización automatizada y decisiones de mantenimiento más basadas en datos.
Tipos de criticidad de los activos
No existe un único marco universal de criticidad. Los distintos enfoques sirven para diferentes niveles de madurez organizativa, sectores y entornos normativos.
Tipo | Descripción | Lo mejor para | Complejidad |
Cualitativo / Por niveles | Los activos se asignan a los niveles A/B/C o 1/2/3 según el criterio del taller. Criterios sencillos, sin puntuación numérica ponderada. Rapidez de ejecución. | Organizaciones que inician su camino hacia la criticidad; bases de activos pequeñas (<5.000 activos) | Bajo |
Semicuantitativo (puntuación ponderada) | Múltiples categorías de consecuencias puntuadas numéricamente y ponderadas según las prioridades de la organización. Produce una puntuación numérica defendible y una clasificación por niveles. Alineado con los marcos API 580 y SMRP. | La mayoría de las empresas de petróleo y gas, servicios públicos, minería y química. Se integra bien con SAP PM e IBM Maximo. | Medio |
Basado en el riesgo (probabilidad × consecuencia) | Combina la probabilidad de fallo (utilizando modelos de degradación, datos de inspección, edad/condición) con las consecuencias de la criticidad para generar un Número de Prioridad de Riesgo (RPN) y trazar los activos en una matriz de riesgo. | Petróleo y gas, productos químicos, generación de energía: activos con un rico historial de fiabilidad de la GMAO | Alta |
Centrado en la fiabilidad (RCM-Driven) | Criticidad integrada en un análisis RCM completo - Análisis Modal de Fallos y Efectos (AMFE) asignado a fallos funcionales. Cada tarea de mantenimiento se justifica a partir de la lógica de la criticidad. Máxima fidelidad, pero mayor consumo de recursos. | Activos de alto valor y baja densidad de población en las industrias energética, ferroviaria y de procesos. Suele aplicarse a los 5% superiores de los activos críticos. | Muy alta |
Condición de criticidad modificada | Clasificación estática de la criticidad de los activos ajustada dinámicamente en función de la puntuación del estado actual de los activos a partir de los resultados del mantenimiento predictivo, las calificaciones de las inspecciones o los datos de los sensores. Un activo de nivel B en mal estado puede elevarse temporalmente al nivel de urgencia A. | Organizaciones con programas CBM maduros e integración de IoT/sensores | Medio-Alto |
Enfoque Verdantis de la criticidad de los activos
Verdantis aporta un enfoque nativo de IA a la criticidad de los activos, reconociendo que la barrera fundamental para una puntuación precisa de la criticidad no es la metodología, sino la calidad de los datos y la gobernanza de la taxonomía junto con gestión de datos maestros de activos.
La mayoría de los programas de criticidad de activos fracasan silenciosamente porque se construyen sobre registros de activos que están incompletos, son incoherentes o no se mantienen.
Verdantis comienza cada compromiso de criticidad con una evaluación de la salud de los datos de los activos, antes de que comience cualquier puntuación. El principio: no se puede puntuar con precisión lo que no se puede describir con precisión.
Mientras que muchos enfoques se centran en la metodología de puntuación, Verdantis se centra en la capa de datos subyacente.
Una bomba con una puntuación de 4,8 que en realidad es un duplicado de una bomba de servicio público con una puntuación de 1,2 conduce a una mala asignación catastrófica de los recursos de mantenimiento. La integridad de los datos no es un requisito previo, sino el propio programa de criticidad.
Verdantis Criticidad de los Activos : Metodología en 8 etapas
- Detección de datos de activos y evaluación de la preparación
El proceso comienza con la extracción del registro de activos de los sistemas CMMS/EAM del cliente (SAP PM, Maximo, Oracle, Infor). Se evalúa la preparación de cada activo mediante la valoración de la disponibilidad de atributos clave como el tipo de equipo, la ubicación y el contexto operativo.
Las lagunas de datos, como las jerarquías que faltan, los registros duplicados o los atributos incompletos, se identifican en una fase temprana para garantizar que sólo se incluyan en la evaluación los activos fiables y puntuables.
- Estructuración de activos y enriquecimiento del contexto
Los activos se estandarizan utilizando marcos alineados con la industria (ISO 14224, ISO 55000), garantizando una clasificación de equipos y estructuras jerárquicas coherentes.
El contexto operativo faltante se enriquece utilizando las referencias de ingeniería disponibles, como los P&ID, los datos de los OEM y el historial de mantenimiento, lo que permite una puntuación de la criticidad más precisa y coherente.
- Configuración del marco de criticidad
Se configura un marco de puntuación a medida basado en el entorno operativo del cliente. Esto incluye:
- Definición de categorías de consecuencias (seguridad, producción, costes, medio ambiente)
- Asignación de ponderaciones
- Establecimiento de baremos y umbrales de puntuación
Esto garantiza que el modelo refleje el riesgo operativo real y las prioridades empresariales.
- Preclasificación escalable de activos
Utilizando el marco configurado y los datos enriquecidos de los activos, se genera una puntuación inicial de criticidad en toda la base de activos.
La puntuación aprovecha la clase de equipo, el contexto del proceso y el mapeo del impacto de los fallos para producir un perfil de criticidad de referencia coherente y escalable.
- Ingeniería de validación y calibración
Las puntuaciones de criticidad se revisan y calibran centrándose en los activos de alto impacto y los casos límite.
Este paso garantiza la coherencia de la puntuación, elimina las anomalías y ajusta los resultados al comportamiento real de la planta y a las dependencias operativas.
- Integración del registro de criticidad
Las puntuaciones de criticidad y los niveles finalizados se integran en el sistema GMAO/MAE del cliente a nivel de equipo.
Esto convierte la criticidad en un parámetro operativo, directamente utilizable para la planificación del mantenimiento, la priorización y la elaboración de informes.
- Alineación de la estrategia de mantenimiento
Los niveles de criticidad se asignan a estrategias de mantenimiento:
- Alta criticidad → Mantenimiento predictivo / basado en la condición
- Medio → Mantenimiento preventivo
- Bajo → Run-to-failure
Este paso garantiza que la evaluación se traduzca en acciones prácticas de MRR y en un esfuerzo de mantenimiento optimizado.
- Gobernanza y actualizaciones continuas
Se establece un enfoque de gobernanza estructurado para mantener la relevancia de la criticidad a lo largo del tiempo. Esto incluye:
- Actualizaciones periódicas basadas en el estado y el rendimiento de los activos
- Incorporación de nuevos activos y cambios operativos
- Propiedad definida para mantener la precisión
Esto garantiza que la criticidad de los activos siga siendo dinámica y se ajuste a las necesidades operativas en tiempo real.
Retos y problemas comunes
A pesar de su aparente simplicidad, los programas de criticidad de activos fracasan o se estancan de forma rutinaria, a menudo por razones estructurales y organizativas, no técnicas.
- Problemas de calidad de los datos
La puntuación de la criticidad sólo es tan buena como los datos de los activos subyacentes. La falta de atributos de los equipos, la ausencia de funciones de proceso, la falta de contexto operativo y la ausencia de historial de modos de fallo conducen a una puntuación basada en la intuición más que en la evidencia.
- Los registros de activos duplicados distorsionan las poblaciones de puntuación
- La falta de una jerarquía de ubicaciones funcionales bloquea la propagación de consecuencias
- No hay relación entre el registro de activos y los P&ID del proceso
- Los datos de la GMAO nunca se validan tras la migración o puesta en marcha del ERP
- La taxonomía incoherente de sustantivos y modificadores hace imposible la puntuación a nivel de clase.
- Subjetividad y sesgo en la puntuación
Cuando la criticidad es evaluada por un único ingeniero sin un marco definido, refleja la experiencia personal y el sesgo de la memoria. Distintos ingenieros puntúan activos idénticos de forma diferente. Los cuasi accidentes recientes inflan las puntuaciones de seguridad; la familiaridad con un activo puede sesgar las puntuaciones a la baja.
- Silos organizativos
La seguridad, el mantenimiento, las operaciones y la cadena de suministro rara vez se ponen de acuerdo sobre lo que significa "crítico". Un equipo de salud, seguridad y medio ambiente puede calificar de crítico un depósito por su exposición medioambiental, mientras que el de operaciones lo considera no crítico porque tiene redundancia total. Sin un marco de puntuación común y una gobernanza interfuncional, estos conflictos siguen sin resolverse.
- Pensamiento puntual
Muchas organizaciones realizan un ejercicio de criticidad una vez, lo integran en la GMAO y nunca vuelven a revisarlo. Las plantas evolucionan, se instalan nuevos equipos, los perfiles de producción cambian, la normativa se endurece. Un registro de criticidad estático resulta cada vez más impreciso.
- No se ha definido un desencadenante formal para la reevaluación tras los eventos MOC
- El registro de criticidad diverge del maestro de activos de GMAO con el tiempo
- Los activos dados de baja conservan en el sistema las puntuaciones de criticidad antiguas
- No hay un responsable de la gobernanza que imponga una cadencia de revisión
El caso empresarial de la gestión de la criticidad de los activos
Se calcula que los tiempos de inactividad imprevistos cuestan a las empresas industriales unos 1.400 millones de euros al año en todo el mundo. Los programas de criticidad de activos son una de las inversiones con mayor ROI que una empresa puede hacer para reducir esa cifra.
Sin un marco de criticidad, los equipos de mantenimiento tratan todos los activos con la misma urgencia, lo que provoca un despilfarro de recursos en equipos de baja consecuencia, mientras que los activos realmente críticos reciben un mantenimiento insuficiente.
El efecto Pareto es coherente en todos los sectores: aproximadamente 5-10% de activos representan 70-80% del total de tiempos de inactividad y riesgos para la seguridad.
Activo vs. Equipo vs. Piezas de repuesto vs. Ubicación funcional Criticidad
Estos términos suelen utilizarse indistintamente de forma incorrecta. Cada uno de ellos representa un nivel distinto de la jerarquía de activos, puntuado con criterios diferentes, propiedad de equipos distintos y utilizado para tomar decisiones diferentes.
Criticidad de los activos:
La clasificación más amplia. Puntúa un activo físico (un equipo o sistema individual) en función de las consecuencias de un fallo en las dimensiones de seguridad, medio ambiente, producción, coste y normativa. Es la clasificación principal de la que se derivan todas las demás.
Criticidad de los equipos
Una subclasificación dentro de la criticidad de los activos centrada específicamente en el objeto físico del equipo: su estado, antigüedad, capacidad de mantenimiento y robustez del diseño. A menudo se utiliza en programas RCM para diferenciar entre tipos de activos idénticos en función de su contexto operativo y su historial de fallos.
Criticidad de las piezas de recambio
Clasificación de las piezas de recambio MRO y materiales en función de sus consecuencias de no disponibilidad en el momento del fallo del activo. Hereda de la criticidad del activo principal, pero se puntúa además en función del plazo de entrega, la posibilidad de sustitución y la ventana de impacto de las consecuencias del fallo.
Criticidad de la ubicación funcional
Clasifica una posición en la jerarquía de la planta, una ubicación funcional o unidad operativa en lugar de un equipo individual. Se utiliza en plantas grandes y complejas para priorizar qué unidades o áreas de proceso reciben más recursos de mantenimiento y atención presupuestaria.
Criticidad del sistema/proceso
Evalúa la criticidad de todo un sistema (por ejemplo, sistema de agua de refrigeración, detección de incendios y gases, sistema de aceite lubricante) en lugar de componentes individuales. Se utiliza en industrias de seguridad crítica y de procesos en las que el análisis de fallos a nivel de sistema es obligatorio en virtud de normativas como PSSR, PED o requisitos SIL.
Parámetro | Tipo 01: criticidad de los activos | Tipo 02: criticidad de los equipos | Tipo 03: Criticidad de las piezas de recambio | Tipo 04: Ubicación Funcional Crítica | Tipo 05: Criticidad del sistema / proceso |
Nivel jerárquico | Equipo / Nivel de etiqueta | Etiqueta del equipo / Número de serie Nivel | Material / Nivel de código de existencias (lista de materiales) | Nivel de planta / unidad / sistema / subsistema | Sistema / Proceso Nivel de función |
Anotado por | Taller multidisciplinar (HSE, Operaciones, Mantenimiento) | Mantenimiento / Ingeniería de fiabilidad | Gestión de materiales + Mantenimiento | Gestión de activos + Planificación de la producción | Ingeniería de procesos y seguridad + Operaciones |
Salida | Clasificación A / B / C + puntuación numérica | Condición y criticidad ajustada al fallo | Política de existencias (in situ / almacén / a la carta) | Clasificación de las unidades críticas | Criticidad del sistema para HAZOP / SIL |
Unidades | Estrategia de mantenimiento, planes de inspección, frecuencia de PM | Alcance de la inspección, planificación de la revisión | Niveles de inventario, existencias de seguridad | Planificación del cierre, asignación de recursos | Caso de seguridad, determinación SIL |
Almacenado en | GMAO / EAM maestro de equipos (SAP PM, Maximo) | Órdenes de trabajo y registros de inspección de GMAO | ERP / SGA (SAP MM, Oracle INV) | Ubicación técnica de GMAO (SAP FL) | Sistemas de seguridad / Registro P&ID |
Revisión Trigger | Eventos MOC, nuevos activos, ciclo de revisión anual | Actualizaciones posteriores al fallo | Cambios en los plazos de entrega, ruptura de existencias | Cambios en el proceso o la producción | Revalidación HAZOP, auditorías |
Ejemplo | Bomba centrífuga P-1001 = Nivel A crítico (puntuación 4,6 | P-1001 envejecido frente a P-1002 nuevo | Rodete → Recambio de capital | Unidad de compresión de alimentación crítica | Sistema ESD = SIL 2 |
- Contexto del mercado
Dimensión | Activo | Equipamiento | Piezas de recambio | Loc. funcional | Sistema |
Pregunta principal | ¿Cuál es el impacto si este activo falla? | ¿Qué probabilidades hay de que falle esta unidad en concreto, dado su estado? | ¿Qué ocurre si esta pieza no está disponible en caso de avería? | ¿Qué área de la planta es más crítica para la continuidad de la producción? | ¿Qué consecuencias tendría el fallo de este sistema para la seguridad y el proceso? |
Unidad de puntuación | Etiqueta del equipo (por ejemplo, P-1001) | Serie / instancia del equipo | Material / código de stock (por ejemplo, 10042211) | Ubicación funcional SAP / Unidad operativa | Sistema de proceso (por ejemplo, agua de refrigeración, ESD) |
Criterios clave de puntuación | Seguridad, medio ambiente, producción, costes, normativa | Grado de condición, MTBF, complejidad de la reparación, antigüedad | Plazo de entrega, criticidad de los padres, posibilidad de sustitución, frecuencia de uso | Rendimiento del proceso, redundancia, impacto posterior | Clasificación SIL, gravedad del peligro, disponibilidad de salvaguardias |
Producción primaria | Nivel A / B / C + puntuación numérica | Criticidad modificada (elevada o reducida) | Política de existencias: Capital / Almacén / A la carta | Clasificación de las prioridades de la unidad (presupuesto, alcance de la parada) | Nivel de integridad de la seguridad, categoría de mantenimiento |
Propietario | Gestor de activos / mantenimiento | Ingeniero de fiabilidad | Responsable de Materiales / Inventario | Gestor de activos / Director de planta | Ingeniero de Seguridad de Procesos / SIL |
Frecuencia de revisión | Anual + MOC activado | Ciclo posterior al fallo + inspección | Anual + plazo / desmantelamiento desencadenado | 3-5 años + cambio importante del proceso | Ciclo de revalidación HAZOP (3-10 años) |
Norma aplicable | ISO 55000, API 580, SMRP | ISO 14224, IEC 60300 | SMRP BP 2.1, GFMAM | ISO 55000, PAS 55 | IEC 61511, IEC 61508, PSSR |
Criticidad de los activos frente a riesgo de los activos
A menudo se confunden estos dos términos. Es fundamental distinguirlos correctamente:
Criticidad de los activos es la consecuencia potencial del fallo, es decir, la gravedad del impacto cuando el activo falla, independientemente de la probabilidad de que se produzca el fallo. Es estático y se basa en escenarios.
Riesgo del activo = Criticidad × Probabilidad
Incorpora la probabilidad de fallo, la tasa de degradación y los datos de fiabilidad. El riesgo informa de las tácticas de mantenimiento; la criticidad informa de la estrategia de mantenimiento.
Criticidad a nivel de pieza de recambio
La criticidad de los activos es sólo la mitad de la ecuación. La criticidad de las piezas de repuesto determina qué componentes deben almacenarse in situ, cuáles pueden pedirse a demanda y cuáles representan un seguro estratégico contra pérdidas de producción catastróficas.
En las industrias intensivas en capital, los costes de mantenimiento de las existencias de piezas de recambio son, por término medio, los siguientes 20-30% del valor de las acciones al año.
Las organizaciones suelen tener decenas de millones de dólares en piezas de repuesto estancadas y con exceso de existencias para activos no críticos, mientras que, al mismo tiempo, sufren desabastecimientos de repuestos críticos que detienen la producción. El análisis de criticidad de las piezas de repuesto aborda directamente este desequilibrio.
Enfoque Verdantis de la criticidad de las piezas de recambio
La criticidad de las piezas de repuesto en Verdantis es una extensión de la criticidad de los activos, con una metodología específica que aborda los desafíos únicos de los datos maestros de MRO, los materiales duplicados y la racionalización del inventario.
Limpieza de datos MRO y Deduplicación
Antes de realizar la puntuación de la criticidad de los activos, las organizaciones deben asegurarse de que sus datos MRO están limpios, estandarizados y libres de duplicados. En muchos casos, 15-35% de los catálogos MRO contienen registros duplicados o casi duplicados, lo que lleva a múltiples códigos de stock para el mismo artículo y niveles de inventario inflados. Abordar este problema mediante la limpieza y deduplicación de datos basada en IA ayuda a consolidar el inventario, reducir los costes de transporte y mejorar la precisión de los datos. Este paso se gestiona normalmente como actividad de preparación de datos fundamentales junto con iniciativas de criticidad mediante Harmonize, nuestra plataforma de enriquecimiento de datosGarantizar que todas las decisiones posteriores se basen en información coherente y fiable.
Enlace entre activos y piezas de recambio (lista de materiales)
Cada pieza de recambio está vinculada a su(s) activo(s) superior(es) en la GMAO, lo que crea una lista de materiales funcional. Sin este vínculo padre-hijo, las piezas de recambio no pueden heredar la criticidad del activo. Verdantis utiliza la construcción de listas de materiales asistida por IA, con referencias cruzadas a la documentación OEM, órdenes de trabajo históricas y registros de mantenimiento para construir o validar listas de materiales de equipos a escala.
Puntuación de la criticidad de las piezas de recambio
Cada pieza de recambio se puntúa utilizando un modelo de cinco factores:
- Criticidad de los activos de la matriz,
- Puntuación del plazo de entrega del proveedor,
- Sustituibilidad/disponibilidad de piezas en el mercado libre,
- Frecuencia histórica de averías/consumo,
- Consecuencia de la falta de disponibilidad
Las puntuaciones generan un Índice de criticidad de las piezas de repuesto (SPCI) que se asigna directamente a una política de almacenamiento: repuesto de capital in situ, existencias en almacén con punto de reorden o pedido según demanda.
Seguro Identificación de recambio
En el caso de los componentes con plazos de entrega largos y un único punto de fallo en activos de nivel A (devanados de transformadores de gran tamaño, rotores de compresores específicos de fabricantes de equipos originales, válvulas de control especializadas), Verdantis facilita una evaluación del repuesto seguro, sopesando el coste de almacenar la pieza frente a la exposición a pérdidas de producción durante el plazo de aprovisionamiento. Estas decisiones se documentan financieramente y se cargan como repuestos de capital en la GMAO.
Racionalización de inventarios y revisión de Slow-Mover
Las piezas de recambio no críticas con un movimiento nulo o casi nulo y sin vínculo con el activo de origen de alta criticidad se marcan para su eliminación o devolución al proveedor. Verdantis proporciona un registro de racionalización en el que se identifican las existencias sobrantes, los artículos obsoletos (cuando el activo de origen se da de baja) y los artículos con exceso de existencias en relación con la tasa de consumo. Las reducciones típicas del valor de inventario de 15-25% se consiguen en 12 meses.
Aplicación de la política de existencias e integración de la GMAO
Las políticas de almacenamiento aprobadas se cargan en el GMAO, estableciendo niveles mínimos/máximos, puntos de pedido, cantidades de existencias de seguridad y campos de proveedor preferente/plazos de entrega por código de existencias. Verdantis permite la integración con los sistemas de gestión de almacenes y de aprovisionamiento para garantizar que las políticas se aplican y no solo se documentan en una hoja de cálculo.
La criticidad de las piezas de repuesto no es un ejercicio de racionalización puntual. Debe ser un programa de mantenimiento continuo, activado por nuevas instalaciones de activos, eventos de desmantelamiento, cambios en los plazos de entrega de los proveedores y ciclos de revisión anuales, todo ello gestionado a través de la misma plataforma MDM que el registro de criticidad de activos.
Conclusión
La criticidad de los activos es una infraestructura fundamental para el mantenimiento y la gestión de activos modernos. Las organizaciones que la tienen y la mantienen adecuadamente, toman sistemáticamente mejores decisiones sobre dónde desplegar los recursos de mantenimiento, cómo almacenar las piezas de repuesto y dónde invertir el capital.
Para pasar de un conocimiento informal de los activos a un programa de criticidad integrado en GMAO y gobernado formalmente se necesitan normalmente entre 3 y 9 meses, en función del tamaño de la base de activos y de la madurez de la calidad de los datos. El retorno de la inversión es sistemáticamente positivo en todos los sectores industriales: reducción del tiempo de inactividad no planificado, reducción de los costes totales de mantenimiento, optimización de la inversión en inventario, mayor cumplimiento de la normativa y un proceso de asignación de capital más defendible.
La evaluación de la criticidad de los activos es la piedra angular de una estrategia eficaz de MRR. Cuando se aplica correctamente, transforma el mantenimiento de una función reactiva a una función disciplina basada en el riesgo y el valor.
Al concentrar los esfuerzos de ingeniería, los recursos de mantenimiento y la inversión en inventario donde más importan, las organizaciones pueden conseguir:
Reducción de los tiempos de inactividad imprevistos
Coste de mantenimiento optimizado
Mejora de la fiabilidad de los activos
Mejor control del riesgo
Verdantis se asocia con organizaciones intensivas en activos para ofrecer esta base y la inteligencia de criticidad que se asienta sobre ella, combinando la experiencia en gestión de datos MRO, la automatización nativa de IA y una profunda capacidad de integración para hacer de la criticidad de los activos un programa operativo vivo en lugar de un documento estático.