A production line in a large manufacturing facility comes to a sudden halt. It’s a critical pump in the cooling system that fails without warning. As the production belt starts to heat up, operators are forced to shut down the entire process. What follows is a chain reaction, starting with idle labor and missed delivery timelines, culminating in expedited spare parts and mounting pressure.
Do you know that such unplanned downtime costs US manufacturers up to $207 million per week? And as many as 55% of businesses face these scenarios once every year.
What if this downtime can be planned for? Many asset-heavy industries already have planned downtimes in their strategies. They are usually for planned maintenance when assets are not in use or similar. However, organizations can also prevent unplanned downtime by mitigating unexpected events. And that’s where condition monitoring comes into the picture.
If you are wondering what condition monitoring is, it is the process of continuously or periodically tracking the health of machinery or equipment. This is done with the help of sensors that capture data on an asset’s health factors, such as vibration, oil, temperature, and pressure. Based on this data, maintenance teams can detect anomalies from normal operating behavior.
How Condition-Based Monitoring Shifts Maintenance Thinking
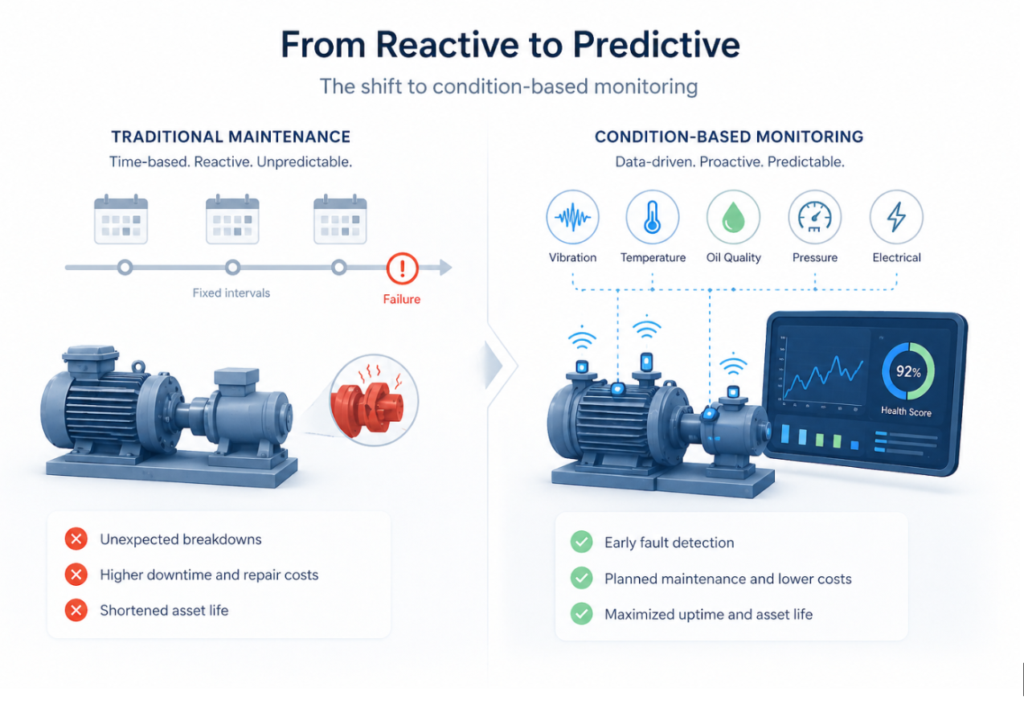
Equipment is never predictable, and yet, most traditional strategies were built around predictability. Teams relied on fixed schedules based on the predictability of failures. For example, a machine that is more prone to failure would receive maintenance twice a month. Something like a bearing, on the other hand, will be replaced every six months.
While this approach offers a structure, it also introduces inefficiencies. What if a component of a system is replaced earlier than its life expectancy? Or what if a component fails because its health was never assessed in real-time?
Condition monitoring changes this from the foundational level. Put simply, it shifts the entire focus from when maintenance should happen to why it should happen.
This shift introduces a benchmark operational expectancy from a machine or an asset. Over time, sensors help track deviations from that benchmark, enabling maintenance teams to be proactive. Instead of waiting for failure to occur and then reacting, maintenance can begin as issues start to appear.
Because of this shift, the demand for condition monitoring systems is rising globally. According to Fortune Business Insights, the market was worth $3 billion in 2025. With a CAGR of 9.7% from 2026 to 2034, it is estimated to more than double and reach $6.8 billion.
This shift is not just about transitioning from calendar-based to condition-based maintenance. It is also about switching from lagging to leading indicators and from reactive maintenance to proactive planning.
The table below shows how condition-based monitoring shifts the entire maintenance organization:
| Merkmal | Traditional monitoring | Condition-based monitoring |
|---|---|---|
| Primary trigger | This monitoring is based on fixed schedules, so inspection during one of those cycles or complete failure will be the trigger point | Triggers are based on real-time thresholds |
| Asset knowledge | Maintenance plans are curated based on general manufacturer recommendations | Knowledge of the vital signs of each asset is gathered in real time |
| Team culture | Teams are rewarded for fixing things fast | Here, the reward is not for fixing but for keeping things running |
| Inventory | Stocked based on historical buying patterns | Inventory is optimized at the right time based on asset health and failure prediction |
A Multi-Parameter View of Asset Monitoring
Although it is possible for equipment to fail for a single reason, that is not the case more often than not. Mechanical, thermal, and chemical changes can all occur simultaneously. That’s why it becomes important to consider multiple aspects of an asset’s health at once. Asset condition monitoring facilitates this by tracking different health parameters.
Each of these parameters gives a glimpse into how a machine is operating in real time. Temperature, for instance, highlights thermal stress and energy loss, and is one of the earliest signs of fault. It points to increased friction in bearings, electrical resistance in motors, or reduced cooling efficiency.
Pressure, on the other hand, provides insight into fluid flow. For example, a drop in pressure indicates a leak somewhere, while a spike could mean resistance or a blockage.
Oil quality parameters also serve as diagnostic media for direct evidence from inside the machine. Viscosity influences lubrication performance, metal particles signal wear, and water contamination accelerates corrosion. Since every imbalance, misalignment, looseness, and bearing defect generates unique frequency patterns, vibration becomes another information-rich factor.

All these parameters can provide insights into machine failure at an early stage. However, it is best to interpret these signals together. This will get you a holistic view of the problem. Through this view, you can work with the maintenance and engineering teams to identify and address the issues at their root causes.
Condition Monitoring Techniques
As noted in the previous section, there are multiple equipment parameters you must monitor. And for that, different techniques are used, each leveraging a different type of sensor to collect relevant information. Understanding which technique is the best fit to find what anomalies makes the entire condition-based monitoring a whole lot easier.
Vibration Monitoring
Analyzing vibrations of rotating machinery is one of the oldest and most used condition monitoring techniques of condition-based monitoring. According to Future Market Insights, it holds around 30.6% of the total condition monitoring system market share.
The sensors used for this monitoring technique are called accelerometers. They collect vibration data that you can process using frequency spectrum analysis as well as envelope detection.
The primary goal of these systems is to detect imbalance, shaft misalignment, and other mechanical issues at early stages.
Electromagnetic Monitoring
Electromagnetic monitoring tracks magnetic field variations, which is why it works only for electrical equipment. The analysis output from this technique is associated with the flow of current in a motor, or with how the rotor interacts with the stator.
Sensors used here collect flux-pattern data and electromagnetic emissions from a running machine. These signals can then be analyzed for asymmetry or distortion.
Electromagnetic monitoring is best at detection:
- Broken rotor bars
- Stator winding faults
- Air gap eccentricity
- Electrical imbalance
This technique is valuable for a comprehensive view because it detects internal motor faults without the need for shutdown or disassembly.
Infrared Thermography
This technique lets you visualize the temperature distribution, a key indicator of machine health. When a piece of equipment has to make extra efforts to deliver standard outputs, it starts to warm up. Detecting this rising heat early on can signal potential underlying problems that may lead to failure if not handled promptly.
Besides sensors, cameras are also used to gather infrared thermography data. These infrared cameras capture thermal images to pinpoint where heat is generated most. If the heat level exceeds a given threshold, the condition monitoring solution can trigger an automated alert to the maintenance team.
Using this technique, you can detect insulation degradation, bearing overheating, and blocked airflow or cooling issues.
Laser Interferometry
As the name suggests, this technique uses laser beams to detect anomalies across different patterns. Since it involves creating and monitoring patterns with laser beams, it is one of the most accurate condition monitoring techniques.
You can track changes down to the micron or nanometer scale. Because of this, it is popular in industries where precision affects product quality, such as semiconductors or aerospace. But while it is very effective and accurate, it is also slightly costly to implement.
When installed properly, this can detect shaft misalignment, microvibrations, and structural deformation under load.
Oil Analysis
If you want to check how a machine is performing internally, oil analysis provides a straightforward way to do so. It examines the lubricant as it moves throughout the system. And because of that, oil also carries all the evidence of wear and corrosion across the machine.
Most other techniques on this list require sensors, but that’s not true for oil analysis. Here, oil samples are collected and processed in labs. However, inline sensors can still be there and can track parameters like viscosity and particle count.
This technique is best at detecting:
- Gear and bearing wear
- Contamination
- Lubricant breakdown
- Early-stage internal damage
Acoustic Emissions Testing
Acoustic is all about frequency, and that’s what acoustic emissions testing detects. Every machine generates some frequency, whether due to friction, rotation, or material deformation. Regardless of the cause, the generated frequency can be monitored and compared with baseline data using sensors that detect transient elastic waves.
These sensors are best at detecting crack formation or surface friction. Apart from that, it also catches early bearing defects and structural stress concentration.
Ultrasonic Analysis
Ultrasonic analysis focuses on high-frequency sound waves that are not audible to humans. The sensors used in this technique can either be handheld or fixed. They capture ultrasonic waves, which are then converted into audio or visual formats for analysis.
The best use case for ultrasonic analysis is to detect anomalies in both mechanical and electrical systems. It can find compressed air, gas leaks, steam leaks, and electrical arcing.
Radiography Analysis
Radiography uses X-rays or gamma rays to find any issues inside a machine without dismantling it. As in medical imaging, images are created based on how rays pass through the equipment. This allows highlighting inconsistencies by comparing the output with the baseline data.
Best at detecting:
- Internal cracks
- Voids and inclusions
- Weld defects
- Structural irregularities
This technique is widely popular in high-risk applications where internal integrity is critical, such as pressure vessels and pipelines.
Electrical Signature Analysis
Rotor faults, load imbalances, power-quality disturbances, and other defects produce varying electrical waveforms. Electrical signature analysis can monitor all of them to detect abnormalities. This method allows monitoring of equipment without installing additional mechanical sensors.
Besides the ones mentioned on this list, there are other condition monitoring techniques you can use. For instance, there’s shock pulse monitoring to measure impact waves, wear debris analysis based on the particles found in lubricants, and partial discharge monitoring for small electrical discharges within insulation systems.
How Does Condition Monitoring Work
Condition monitoring begins at the physical interface between a sensor and the asset it is watching. However, that’s not the only part of it. After installing sensors and collecting data, MRO teams need to leverage that data, process the signals, and feed it into an EAM or CMMS.
This process enables management teams to monitor an asset’s health and use that input to extend its life by automatically raising work orders for machines that are not operating optimally.
Sensing and Data Acquisition
Every insight produced, every work order triggered, and every failure intercepted early traces its origin back to this layer. As we saw in the previous section, there are different types of condition monitoring techniques, and each requires a different type of sensor.
Thus, your first important task is to select and install the right sensors on the assets you want to track. For instance, the vibration sensors will collect displacement, velocity, and acceleration data.
Displacement is most informative for large machines, such as paper mills or excavators. This is especially true at low frequencies, like below 10Hz. Velocity, on the other hand, is used for mid-range frequencies, which are between 10 Hz and 1 kHz, while acceleration is used for high-frequency diagnostics above that.
The table below represents different sensor types used to capture different vibration data:
Sensor type | Frequency range | Sensitivity | Noise floor | Best application |
|---|---|---|---|---|
Piezoelectric (IEPE) | 0.5 Hz – 20 kHz | 10–1000 mV/g | Very low | Bearings or any rotatory machine |
MEMS (Micro-Electro-Mechanical Systems) capacitive | DC – 5 kHz | 100–1000 mV/g | Mäßig | Low-speed machines |
Eddy current proximity probe | DC – 10 kHz | 7.87 V/mm | Niedrig | This is good for shaft displacement and journal bearings |
Laser vibrometer | DC – 1 MHz+ | Can vary largely | Very low | Hot or inaccessible surfaces can be monitored |
Velocity sensor (geophone) | 1 Hz – 1 kHz | 20–80 V/(m/s) | Niedrig | Low-frequency structural monitoring |
Similarly, there are different sensor types for gathering different data. If you are not completely sure, you can follow the ISO 17359:2018 framework, which provides guidelines for setting up condition monitoring programs, including selecting sensors. Primarily, the steps are to list failure modes for an asset, identify measurable parameters that change as each failure mode develops, and then select the sensor technology capable of measuring those parameters.
Connectivity and Data Transport
The next challenge is transferring the data from sensors to a system capable of analyzing it. Raw sensor signals are simply values that, in asset-heavy industries, can change hundreds of times within a second. And transferring this data is also way more challenging in such an electrically noisy environment with physically farther network infrastructure than, for example, in an IT firm.
Now, this transmission can be enabled through wired or wireless infrastructure.
Wired Fieldbus and Analog Transmission
Using wires to transfer data is the oldest and still one of the most reliable methods. It uses a 4-20 mA analog current loop. This 4-20 mA is the DC analog current loop in which the transmitter converts the measured signals. Here, 4 mA represents the lowest, or 0%, of the measurement range, and 20 mA represents the highest, or 100%. Transferring data as DC rather than voltage makes the signal immune to voltage drop over long wires.
This information is then passed on and processed through a system such as the Highway Addressable Remote Transducer (HART). HART adds relevant information like the sensor’s health, tag identifier, and other secondary variables to the signals.
Wireless Industrial Networks
Wired sensor installation in a large plant is expensive. Therefore, many choose to go with wireless options, such as WirelessHART or ISA100.11a.
As the name suggests, WirelessHART is the wireless extension of the HART protocol. It operates in the 2.4 GHz ISM band using IEEE 802.15.4 radios. It uses a Time Division Multiple Access mesh network. In this network, every device is also a router, which provides a self-organizing, self-healing network topology.
ISA100.11a is simply an alternative to WirelessHART and performs the same function.
Here’s how the different protocols across different wired and wireless networks can be chosen based on different use cases:
Protocol | Physical layer | Bandwidth | Update rate | Use case |
|---|---|---|---|---|
4-20 mA | It’s a two-wire copper | Single variable (analog) | Continuous | Simple process transmitters |
HART | Follows a 4-20 mA loop | 1200 bps (digital overlay) | On-demand | Diagnostics on existing 4-20 mA devices |
PROFIBUS PA | Two-wire bus | 31.25 kbps | 100-1000 ms | Process automation fieldbuses |
EtherNet/IP | Represents the standard industrial Ethernet | 100 Mbps – 1 Gbps | 1-100 ms | Controller-to-device, high-speed I/O |
WirelessHART | 2.4 GHz 802.15.4 mesh | 250 kbps (shared) | 1-60 s | Wireless process transmitters |
ISA100.11a | 2.4 GHz 802.15.4 mesh | 250 kbps (shared) | 1-60 s | Wireless process transmitters |
5G NR (private) | Sub-6 GHz / mmWave | Up to 1 Gbps | < 1 ms | Dense waveform-level monitoring |
Once this data is on the plant network, it should be accessible to higher systems, such as EAM or CMMS. However, for these systems to access the data, it needs to be in a consistent format. And that’s where service providers like Verdantis can become helpful.
The OPC Unified Architecture, which is published as IEC 62541, has become the standard for this data consistency. It supports OPC-UA Binary and OPC-UA XML encoding options. The encoded data is then transferred via an Internet of Things (IoT) protocol, such as Message Queuing Telemetry Transport (MQTT), which is standardized as ISO/IEC 20922.
Transforming Raw Signals into Diagnostic Features
The data your team has right now simply represents raw physical quantities. It does not directly tell a maintenance engineer what is wrong with the machine. For that, it has to be processed into measurements that carry diagnostic meaning. For instance, it should help identify where in the machine the change originates and which failure mechanism it represents.
Here are some of the most commonly used analysis methods for transforming raw signals into diagnostic features:
Time-Domain Analysis
The simplest way to analyze signals, especially about vibrations, is to work directly with the time waveform. This analysis method removes the need for transforming signals into frequencies to observe them on a spectrum. Instead, it relies on basic statistical measures that can be calculated from this signal and used to monitor the machine condition.
- RMS (Root Mean Square) is about measuring vibration’s overall energy. Higher values indicate more energy is being transmitted, which may indicate wear or damage. It is more effective at detecting ongoing issues and less effective at detecting early faults.
- Peak value and crest factor help capture short impacts that RMS misses. Crest factor is the ratio of the peak value to the RMS value. When sharp impacts occur, the peak increases while the RMS stays low. This raises the crest factor and can trigger a potential problem. Thus, it is useful for spotting early bearing defects.
- Kurtosis measures the severity of the peaks. Like the crest factor, it works well for early fault detection. However, it tends to decrease as the damage becomes more widespread.
Here’s a table representing the use of time-domain analysis:
| Metrisch | Healthy range | Elevated threshold | Fault sensitivity |
|---|---|---|---|
| Metrisch | Healthy range | Elevated threshold | Fault sensitivity |
| RMS | Machine-specific | ISO zone boundary | General vibration severity |
| Crest factor | 2.5 – 3.5 | > 6 | Early bearing defects |
| Kurtosis | ~3 | > 6 (alert), > 10 (alarm) | Very early bearing defects |
| Peak-to-peak | Machine-specific | Per ISO/manufacturer | Shaft displacement, clearance |
The Fast Fourier Transform (FFT)
As the name suggests, the Fast Fourier Transform converts. It converts a time-based signal into frequency-based data. Instead of seeing how vibration changes over time, you see how much energy exists at each frequency. The benefit here is that you can easily identify machine faults because many issues occur at predictable frequencies.
FFT’s accuracy is dependent on the amount of data collected. It follows this relationship:
Resolution (Hz)=Number of samples / Sampling rate
Thus, a longer signal gives better frequency details. The downside, though, is that it requires more time and may introduce unwanted variations.
Some of the common fault patterns you can identify in the frequency using this analysis are:
- Shaft harmonics, which show up as multiples of the rotation speed
- Bearing defects can be identified, as they create specific frequencies based on design and speed. These include outer race (BPFO), inner race (BPFI), ball spin (BSF), and cage frequency (FTF).
- Gear faults appear at the gear mesh frequency (GMF), which is calculated from shaft speed and the number of gear teeth. Here, increased GMF amplitude means uniform wear, and sidebands around GMF represent localized damage.
Envelope Analysis
Envelope analysis is also known as the high-frequency resonance technique (HFRT). The primary use case of this analysis is in detecting early bearing defects. A damaged bearing produces tiny impact pulses each time a rolling element passes over the fault.
Since these pulses are very short, they don’t show up at the defect frequency. Instead, they show defects in higher-frequency resonances (2-20 kHz).
However, to obtain a correct envelope analysis, it is important to select the appropriate frequency range. That’s something that can be done using Spectral Kurtosis. Spectral Kurtosis scans across frequencies to identify where the signal is most impulsive.
Wavelet and Time-Frequency Analysis
The FFT works well for machines operating at a standard speed because it assumes that the signal remains constant. But what if the assets are operating at different speeds or experience sudden faults, shutdowns, and starts? During all these scenarios, FFT falls short, and it is the Short-Time Fourier Transform (STFT) that comes to the rescue.
STFT breaks signals into short overlapping segments. The resulting spectrogram shows how frequency content changes over time. Still, it comes with a limitation that improving time detail reduces frequency accuracy, and vice versa.
Wavelet transforms use flexible functions that adjust their size depending on frequency to overcome that limitation. When high-frequency components are captured with short time windows and low-frequency components use longer windows, wavelets can detect brief events, such as impacts or early fault signals.
Order Analysis for Variable-Speed Machines
Many assets, such as a vehicle powertrain or a wind turbine, can operate at varying speeds. Thus, the resulting vibrations or other signals can also change. This makes frequency graphs messy and hard to read because the signals get spread out. But this change does not necessarily indicate a problem with the equipment.
Order analysis solves this issue by tracking signals across the angular domain, such as per rotation, instead of the time domain. The signals are then monitored with a tachometer, which tracks instantaneous shaft speed.
This way, the frequencies are shown as orders instead of Hz. The result is that problems tied to the machine’s rotation stay in the same place on the graph, even if the speed changes. This makes reading and understanding the final spectrum much easier for maintenance engineers.
Storing and Managing Condition Data at Scale
Suppose a mid-sized manufacturing plant needs to continuously monitor 200 assets. Each asset is instrumented with two vibration channels and two temperature channels. This would sample around 25,000 signals per second and generate roughly 160 GB of raw data per day from vibration alone.
Now imagine a large refinery with 2,000 monitored assets, each equipped with multiple sensors. The scale of data generated and managed will be enormous. That’s why data storage infrastructure for condition monitoring is not an afterthought but a core systems engineering problem. It directly determines what analysis is possible, how far back in time root cause investigation can reach, and how much the program costs to operate.
Because of the sheer volume of data, relational databases such as PostgreSQL, Oracle, and SQL Server will not work. These databases were designed for transactional data that records with a fixed schema and moderate volume.
Time-series databases are purpose-built for this type of access pattern. They leverage compression, write optimization, and time-range query optimization to store and manage condition data at scale.
Data contextualization is another thing that helps maintain data. It is the process of linking time-series data to the equipment master data. The master data maps the physical attributes of the asset, such as its type, location, design parameters, installed components, and maintenance history. This linkage is what allows an analytics model to calculate defect frequencies.
Here’s what the contextualization chain looks like:
| Layer | System | Data object | Beispiel |
|---|---|---|---|
| Field measurement | Sensor / DCS | Raw tag value | 4.8 mm/s @ 14:32:07 |
| Historian | PI / InfluxDB | Tag with timestamp | PMP-223.BRG-DE.VEL.RMS = 4.8 |
| Asset framework | PI AF / CMMS | Tag-to-asset binding | Tag belongs to Pump 223, bearing position DE |
| Ausrüstung Master | SAP PM / EAM | Equipment record | Pump 223 = Centrifugal pump, model XYZ-300, installed 2017 |
| Component master | SAP / CMMS BOM | Component record | DE Bearing = SKF 6312, contact angle 15°, 8 rolling elements |
| Geschichte der Wartung | SAP PM / CMMS | Work order records | Last bearing replacement: 2022-03-14, WO 4500123456 |
Despite having a dedicated database management team, storing and maintaining data at this scale can be challenging. Asset-heavy industries can seek help from third-party service providers to clean master data, standardize and structure new data, and centralize everything for seamless flow from the sensor layer to EAM.
Establishing Statistical Baselines With Analysis
Once the infrastructure to transform and migrate sensor data to the analytics system is in place, the storing and retrieving part is solved. However, the harder problem is to determine baselines or threshold values. Baselines influence whether a condition monitoring program prevents failures or just generates alarm floods.
You can set the baselines based on severity standards. For instance, ISO 10816, now consolidated as ISO 20816, provides absolute severity limits for the RMS overall vibration velocity. However, these have well-documented limitations.
They apply only to the broadband velocity RMS but say nothing about the vibration’s frequency content. This means that they cannot distinguish between imbalance, bearing defects, and resonance. And all of them may produce the same overall RMS but require different maintenance responses.
Thus, many MRO teams rely on dynamic baselines instead of the Statistical Process Control (SPC) framework. Instead of fixed limits, SPC creates baselines from a machine’s own historical data. It primarily tracks two key parameters:
- Mean (μ): Average value
- Standard deviation (σ): Normal variation
Based on this, maintenance teams can calculate baselines using μ±3σ. If readings go outside this level, it indicates a fault. Through this, SPC reduces false alarms using these common methods:
- Shewhart chart: It helps identify sudden large changes
- CUSUM: Detects slow, gradual wear
- EWMA: This method finds small continuous changes
- Moving range: Moving range is used to identify increases in variability
To create dynamic baselines, engineers must track multi-parameter health indices. A single parameter won’t tell the entire story behind the fault. On the other hand, a holistic view through multi-parameter analysis will help conduct effective root cause analysis to prevent the same failures from recurring.
EAM/CMMS Integration to Close the Loop
The final piece of the condition monitoring workflow is to close the loop that started with retrieving sensor data. If a human needs to monitor every alarm and create work orders for each one, the process will become resource-intensive. It will also create leakages that will reduce the efficiency of condition-based asset health monitoring.
The condition monitoring model needs to be integrated with the enterprise asset management (EAM) system. For instance, SAP PM (Plant Maintenance) is the dominant EAM platform in asset-intensive industries. With the condition monitoring system as the source, SAP PM can be automated for a continuous asset health loop.
Whenever a health alert is generated, the system can send it to the SAP PM via the REST API through the SAP Integration Suite. This will create an SAP PM notification that captures all details about the asset and the relevant issue. The system will then automatically create a work order so the maintenance teams can take necessary actions.
| SAP PM object | Integration purpose | Triggered by | Key fields |
|---|---|---|---|
| PM notification (M2) | Record condition alert | Condition monitoring event | Functional location, fault description, priority |
| PM order | Plan and authorize maintenance work | Planner review / auto-creation | Work center, planned tasks, BOM components, dates |
| Measurement document | Store condition readings in SAP | Periodic condition data sync | Measuring point, reading value, timestamp |
| Maintenance item | Link the task list to the equipment for recurring condition tasks | Initial configuration | Equipment, task list, counter |
| Equipment record | Equipment master with technical data | Initial setup / ongoing sync | Equipment class, manufacturer, installed components |
MRO teams can also use IBM Maximo or other CMMS systems for this purpose.
Through this, condition monitoring also helps create a planned horizon for spare parts maintenance. Say a bearing degradation model projects failure 3-6 weeks out with reasonable confidence. In this case, procurement and maintenance teams can work together to get spare parts ready even before the work order is created.
The integration chain for this capability connects the condition monitoring platform to the MRO inventory management system, like Verdantis’ MRO360.
This closed loop is the operational manifestation of predictive maintenance. It converts a technical health assessment into a supply chain action without manual intervention at each step. However, poor equipment master data, such as wrong part numbers in the BOM or unmaintained linkages between equipment records and material masters, can break this chain entirely.
Automated Condition Monitoring
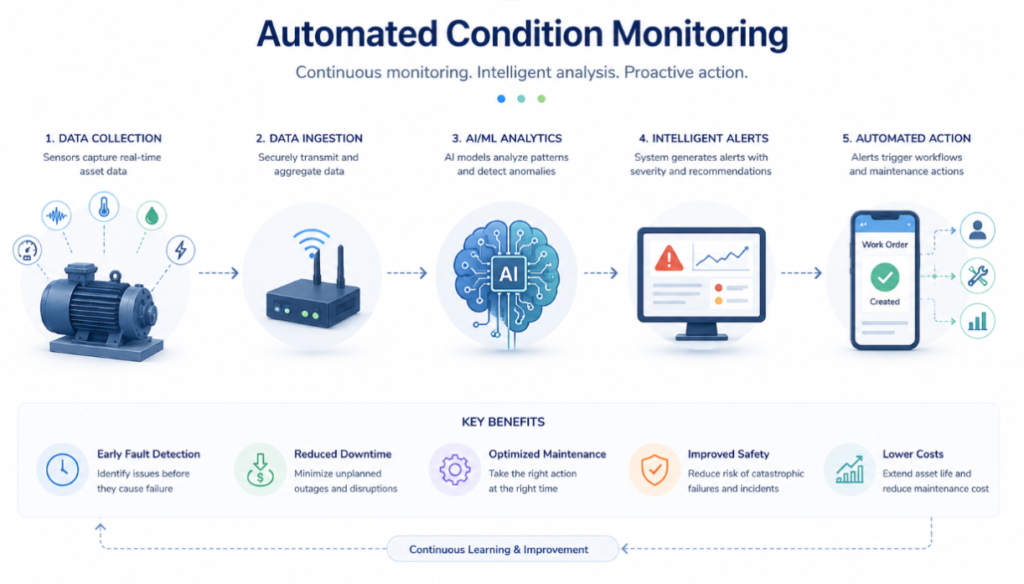
There are many things that a condition monitoring system performs to detect asset health. But these tasks work only when done in an orchestrated, continuous manner. In isolation, none of the processes would be of much help.
Therefore, modern condition-based monitoring systems leverage artificial-intelligence-based automation. They collect sensor data, evaluate it, identify developing faults, and trigger maintenance actions without the need for a human engineer to manually review every data stream every day.
There are different ways in which artificial intelligence (AI) can help not just capture and store data but also analyze it to find anomalies in patterns.
Unsupervised Anomaly Detection
Unsupervised anomaly detection is one way of doing that. Here, the data used to train the condition-monitoring system is not labeled.
Autoencoders are neural network architectures consisting of an encoder and a decoder. After being trained on healthy and poor operational data, these networks can detect patterns in real-time sensor signals. If the signals breach any threshold, autoencoders use them to trigger an automated alarm.
Similarly, there’s the isolation forest algorithm, which uses tree-based anomaly detection and a One-Class Support Vector Machine (OCSVM). All these are unsupervised AI models that can be used within automated condition monitoring.
| Model | Training data required | Interpretability | Skalierbarkeit | Sensitivity tuning |
|---|---|---|---|---|
| Autoencoder | Health equipment data only | Low (within latent space) | Mäßig | Reconstruction error threshold |
| Conv. autoencoder | Health equipment data only | Niedrig | Mäßig | Reconstruction error threshold |
| Isolation forest | Data here could be from health equipment or mixed | Mäßig | Hoch | Contamination parameter |
| OCSVM | Health equipment data only | Low-moderate | Low (O(n²)) | ν parameter |
| PCA-based | Health equipment data only | Hoch | Very high | SPE / T² threshold |
| LSTM autoencoder | Health equipment data only | Niedrig | Mäßig | Sequence reconstruction error |
Supervised Fault Classification
Supervised fault classification is performed using labeled training data. This can be more accurate if specific labeled data for both healthy and poor operating conditions are available. That’s also why having structured maintenance master data is essential for these types of AI models to work in automated condition monitoring systems.
Three primary supervised models are available that are being used across industries:
- Random Forest: A Random Forest trains an ensemble of decision trees on random subsets of training data and feature space. It then aggregates their predictions by voting. Based on this training, Random Forest can output importance scores. These scores are the most predictive indicators for each fault type.
- Support Vector Machines (SVMs): SVMs perform especially well with smaller labeled datasets. This is particularly true when the number of features is large relative to the number of training samples, which is common in condition monitoring.
- Convolutional Neural Networks (CNNs): These neural networks are used to generate images based on sensor signals. They can also match these images with baseline data to identify anomalies. A ScienceDirect study describes a condition-monitoring framework that integrates real-time vibration data with CNNs to enable automated fault detection and predictive maintenance. The trained system accurately detects and classifies faults in the physical system. This demonstrates strong reliability and generalization.
Remaining Useful Life (RUL) Prediction
AI can predict how long an asset can remain useful before temporary failure or complete breakdown. RUL prediction requires modeling a degradation trajectory from the current health state to failure. This trajectory can be very uncertain because it can change from machine to machine.
With its Weibull survival analysis, proportional hazards models, and Long Short-Term Memory (LSTM) networks, AI can help chart this trajectory accurately.
Condition Monitoring and IIoT
In addition to artificial intelligence, the Industrial Internet of Things (IIoT) is an essential technology for automated condition-based monitoring. In fact, all the sensors used to collect and share equipment data are already part of IoT.
Using the two in tandem enables seamless data transfer across integrated systems. With IIoT, all the assets can become smart and interconnected. They can share data with each other through cloud-based platforms to offer a central, comprehensive view to MRO teams.
Furthermore, IIoT also allows controlling machines remotely. So, if a tool is on its way to fail quickly, maintenance teams should turn it off remotely to prevent safety issues and a complete breakdown of the machine.
How to Build a Condition Monitoring Program
A condition monitoring program starts by assessing which assets to track. At some point, you would want to cover as many machines as possible. However, it is best to start small and scale efficiently, rather than try to implement big and fail.
Once you have an understanding of what equipment to monitor, here’s how you can proceed:
Install the Sensors
Once you know which assets to monitor, you will also determine which vitals to track. Based on that, you should first select sensors capable of measuring the required parameters. In addition to selection, focus on determining sensor placement for accurate signal capture.
Collect Data
The next task at hand is to collect data. Your first job is to collect data for machines operating at optimal health. This will help establish baselines or benchmarks for cross-referencing during condition-based monitoring.
When you have the baseline data, set them to collect data continuously or at regular intervals. It is important to ensure consistency here, as gaps in data can reduce the accuracy of analysis.
| Prozess | What happens | Warum es wichtig ist |
|---|---|---|
| Data acquisition | Sensors attached to machines and integrated with condition monitoring systems will send raw signals | This is important for having a continuous view of the asset’s health |
| Time synchronization | The system aligns data from multiple sensors and assets | Allows multi-parameter analysis to obtain a holistic view |
| Data validation | Filters out noise and faulty readings | Helps prevent false alerts that can waste time and resources |
| Storage | Stores real-time data in the backend for analysis and future use | Supports feedback loop, historical trending, and modeling |
Create a P-F Curve
The time interval between the point of functional failure (F) and the point at which a prospective failure becomes detectable (P) is represented by the P-F curve. Because it specifies how early a defect may be detected and how much time is available to take action, it is a fundamental idea in condition-based monitoring.
This concept was initiated in the 1970s for United Airlines and the U.S. Department of Defense. To be effective, condition-based monitoring should occur during the time interval between potential and predicted failure.
Monitor Assets
Once the system is in place, start running condition-based monitoring. Based on the data gathered, benchmarks could be triggers. And based on these triggers, the system could notify relevant teams and raise work orders.
Business Impact of Condition Monitoring
Condition monitoring directly impacts a company’s bottom line.
- Reduced downtime: Downtime is among the most expensive consequences of equipment failure. Condition monitoring minimizes the likelihood of this by detecting potential problems in machines early.
- Better maintenance planning outcomes: Instead of assumptions, work orders are triggered by benchmark data that reveals anomalies in optimal working conditions.
- Increased asset lifespan: As MRO teams focus on asset health rather than fixed schedules, the lifespan of the machine increases.
- Increased safety: A Deccan Herald article reports that five individuals sustained burn injuries because of steam at SAIL’s Bokaro Steel Plant. There are many such incidents in which a machine or system failure results in injuries, and condition monitoring can prevent them.
- Minimized costs: Production losses, emergency repairs, expedited spare parts, workers’ compensation for injuries, etc., are all different costs that can be minimized.
While condition monitoring can offer all these benefits, the outputs depend on how companies collect and store machine data. You can partner with third-party data management service providers if you lack in-house expertise.
A large wood production company operating across 25 plants did this by working with Verdantis. With $7 billion in revenue and a global workforce exceeding 13,000 employees, the company sought help with data cleansing and governance.
Verdantis helped standardize and manage over 300,000 SKUs. It also implemented Verdantis Harmony for automated data governance in the future.
An Overview of Condition-Based Monitoring in Practice
With the help of the sensors and baseline criteria, automated systems can trigger alerts. But what appears as a simple alert on a dashboard is the result of multiple layers of data engineering, signal processing, and decision logic working together in the background.
Put simply, condition-based monitoring systems operate as a closed loop. Data is captured, processed, analyzed, and then fed into maintenance workflows. Thus, performance depends on how well these layers are configured and integrated.
Consider a high-speed packaging line in a manufacturing plant with multiple motors, conveyors, and gearboxes. Here, one of the most critical assets is the conveyor drive system. It is an electric motor connected to a gearbox and belt assembly that powers this system. Even a simple failure here can stop the entire line.
In a traditional setup, the maintenance team will have fixed schedules for inspecting the entire belt and gearbox. But between these inspections, the system runs unchecked. So, if a bearing inside the gearbox starts to degrade right after an inspection, it will go unnoticed till the next inspection or until a failure occurs.
On the contrary, suppose vibration sensors are mounted on the motor and gearbox. Similarly, there are temperature sensors on bearings, oil quality sensors on the gearbox lubrication system, and electricity sensors monitoring motor load. In this case, the data will be continuously fed into monitoring systems. The maintenance team will see the severity level, likely fault type, and recommended action.
| Bühne | What happens | Example from the conveyor system |
|---|---|---|
| Data capture | Sensors will collect real-time signals | Vibration amplitude increases slightly in the gearbox |
| Signal processing | Here, the system will filter the noise and stabilize the signals | The background noise from the vibration signal will be removed for better understanding |
| Feature extraction | Key indicators are calculated | The RMS vibration could be increased |
| Baseline comparison | Comparison between real-time data collected by sensors and the normal profile | Deviation detected from the standard gearbox vibration pattern |
| Correlation | Multiple parameters are evaluated together | An example can be a slight temperature rise along with an increase in vibration |
| Anomaly detection | The system flags any abnormal behavior detected at this point | The analysis may point to an early-stage bearing wear |
| Alert generation | Most modern tools have an automated alert feature that sends a notification to the maintenance team | A warning alert will be triggered in the dashboard |
| Work order creation | The maintenance team will raise a work order for the repair or inspection | Inspection scheduled based on severity and urgency |
Who Is Condition Monitoring For?
Condition monitoring delivers the strongest results in asset-heavy industries, such as:
Heavy Manufacturing
Heavy manufacturing facilities rely on large, interconnected machines, such as mills, conveyors, and rotating equipment. Even small manufacturing plants have advanced to using some machines to either completely automate or aid with manual labor. Thus, assets are essential in the manufacturing industry for continued production.
Condition monitoring tracks vibration, oil, temperature, and more across all these systems. This helps with early detection of issues that could later result in failure and production halt.
Food and Beverage
Unlike other industries, equipment reliability is also tied to product quality and compliance in the food and beverage sector. Mixers, pumps, refrigeration units, and packaging systems must meet strict hygiene standards while operating optimally. One way to ensure this is by tracking whether equipment runs within defined parameters, and condition monitoring can help with that.
Oil and Gas
Equipment in the oil and gas industry is at the highest risk of failure due to operating conditions. Compressors, turbines, pipelines, and drilling machines operate in remote, hazardous conditions. It is not even possible for maintenance teams to regularly inspect these tools when they are running.
Condition monitoring provides continuous visibility into asset health without requiring constant physical inspection. Since many assets operate under extreme conditions, early detection is critical in this sector.
Stromerzeugung
Key assets of the power generation industry include turbines, generators, transformers, and cooling systems. Vibration analysis detects turbine and generator faults, while thermal monitoring identifies overheating in electrical components. Continuous monitoring ensures that even minor deviations are identified early.
ROI of Implementing Condition Monitoring
Calculating the ROI of implementing condition monitoring is not simply about cost-versus-savings calculations. It should be more about the value the process drives. Most companies fail to calculate the true ROI by focusing too much on maintenance savings. Besides that, you should also consider reducing downtime, improving asset health, increasing production capacity, and more.
You should start with a baseline model that includes the cost of downtime, failure frequency, maintenance labor, and quality issues. You can then convert technical metrics into financial outputs.
Here’s what the contextualization chain looks like:
| Technical metric | Financial translation |
|---|---|
| Reduced failure | This will increase uptime and production capacity |
| Early fault detection | Early detection prevents catastrophic failures and the resulting repair or replacement costs |
| Better maintenance planning | Lowers overtime and emergency maintenance costs |
| Improved asset health | This saves money by increasing asset longevity |
Another important thing to consider here is that ROI increases with scale and maturity. With time, its condition monitoring can offer an ROI of 5:1 or 10:1, scaling to 25:1 over three to five years. While it is a ballpark range, the actual ROI could differ based on how efficiently you implement and leverage condition monitoring.
The Data Foundation Problem and Its Solution
Simply attaching sensors to assets and fetching real-time data won’t give you the best results of condition monitoring. Although most planning occurs with real-time data, there’s also a need to structure and standardize it for storage and future use.
For instance, say a condition-based monitoring solution found a vibration anomaly. However, the system cannot determine which bearing triggered the alert because the equipment Bill of Materials (BOM) lists the wrong part number. This will only add to redundancies rather than help prevent equipment failure.
The sensor technology, signal processing algorithms, ML models, and OPC-UA pipelines are all necessary, but they are built on an accurate data foundation.
One of the most pervasive problems is the incompleteness of equipment master data. In practice, equipment master records in SAP PM and equivalent EAM systems can carry incomplete attribute fields. Similarly, MRO spare parts duplication, BOM inaccuracies, and cross-site data inconsistencies can affect data quality and influence the outcomes of condition-based monitoring.
Verdantis can help solve these challenges with its solutions built on years of expertise and excellence. Verdantis Harmonize, for instance, can address the historical data cleansing issue.
The cloud-based platform ingests legacy master data records from SAP, Oracle, IBM Maximo, and other ERP/EAM systems. It then applies a combination of AI-driven processing and human expert review to standardize, enrich, deduplicate, and classify those records to a predefined taxonomy.
While Verdantis Harmonize solves the historical data problem, Verdantis Integrity solves the ongoing governance issue. Integrity works as a bolt-on governance layer integrated with your ERP and EAM systems. When a new material record is about to be created in SAP, it intercepts the creation request and applies a validation workflow before the record is written to the ERP.
All of this comes together in our MRO360 platform. Its MDM Suite comprises both Harmonize and Integrity for clean and accurate data. This enables MRO teams to leverage a clean data foundation for condition-based monitoring that drives informed operational decisions.
Fazit
Condition monitoring is one of the most technically demanding disciplines in industrial operations. While it has a lot to offer, it also requires competencies spanning physical measurement science, high-frequency signal processing, statistical modeling, machine learning, industrial networking, data infrastructure, and enterprise system integration.
Very few organizations have all of these capabilities assembled in one place. And there are even fewer that have them assembled on top of a data foundation clean enough to allow optimal performance.
That is the infrastructure problem that Verdantis has spent two decades solving for asset-intensive organizations. Condition monitoring programs built on clean, governed, enriched master data consistently outperform those that are not.
Connect with our experts to understand how Verdantis can help you create a baseline data foundation for implementing condition monitoring solutions.
Häufig gestellte Fragen (FAQs)
What are the 5 elements of condition monitoring?
The five key elements of condition monitoring are data collection, data analysis, alert generation, maintenance planning, and continuous improvement. Together, these elements enable a proactive approach to continuously monitoring a machine’s health for optimal operations.
What is the difference between PdM and CBM?
Both predictive maintenance (PdM) and condition-based monitoring (CDM) are proactive maintenance approaches. However, they differ in timing and technology. PdM collects sensor data and predicts failure by analyzing it. On the other hand, CDM focuses on comparing real-time data against a set threshold to detect when a machine or piece of equipment falls below optimal health.
What are the 5 types of monitoring?
In maintenance, repair, and operations, common types of monitoring techniques include vibration, temperature, pressure, oil, and ultrasonic monitoring. However, there are many other aspects of an asset that MRO teams can monitor.