Global gold miner

Five mines, five SAP instances, one view of every spare.

~$26M
working capital released
47%
less emergency procurement
10 wks
to go live, SAP kept
Read the story
Product
Solutions
Customers
Resources
Company
Book a demoGet a free diagnostic
MRO360 module 5 of 9: decide what to hold

Slow moving inventory and dead stock analysis Know what moves, what sits, and what it costs you.

Every SKU at every plant is classified as fast, slow or non-moving, with turnover, days of supply and annual value. Management gets a working-capital figure, not a classification report.

Nobody has measured what isn't moving.

Slow and non-moving stock hides inside total inventory value until someone runs the numbers part by part.

Today

One inventory number

  • Nobody has measured how much inventory hasn't moved in years.
  • Fast and slow movers are governed by the same stocking rules.
  • Dead stock is reviewed once a year, at the physical count.
With MRO360

Every SKU classified and valued

  • Velocity calculated continuously for every SKU and plant.
  • Each class gets its own action: hold, review policy, transfer or write off.
  • Non-movers flow straight into Obsolete Check.
42%
of inventory value had no goods movement in 24 months, computed from the customer's own extract within days.Multinational mill-based manufacturer

Fast, slow and non-moving, in dollars.

Every SKU is classified from its goods movements, valued and routed to the right next step. Critical spares stay protected.

A dollar value on every insight

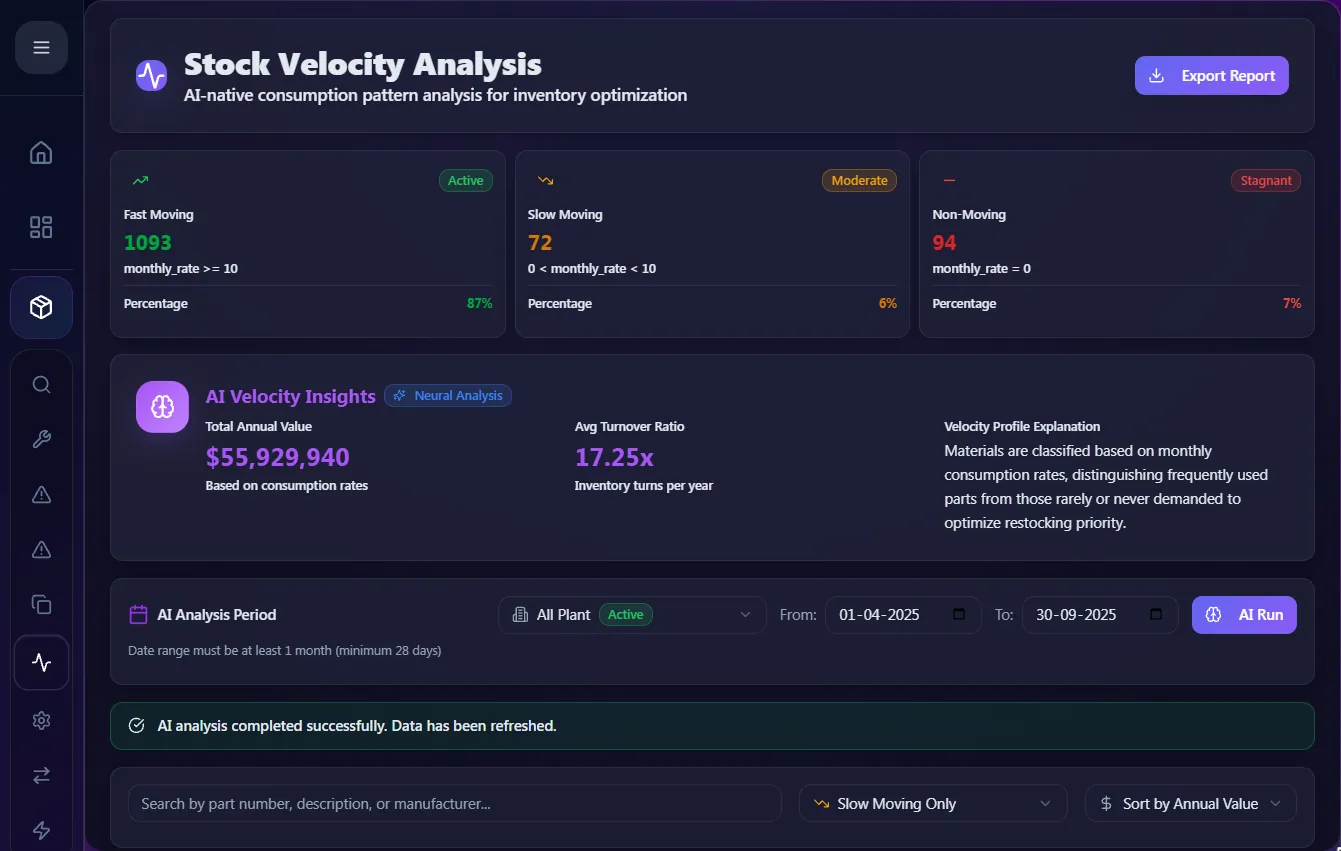
Fast, slow and non-moving counts with total annual value and average turnover, explained in plain language for the people who sign off on working capital.

  • Analysis period you choose (28 days minimum)
  • Turnover ratio and days of supply per part
  • Export the report for finance
MRO360 slow moving inventory screen: A dollar value on every insight

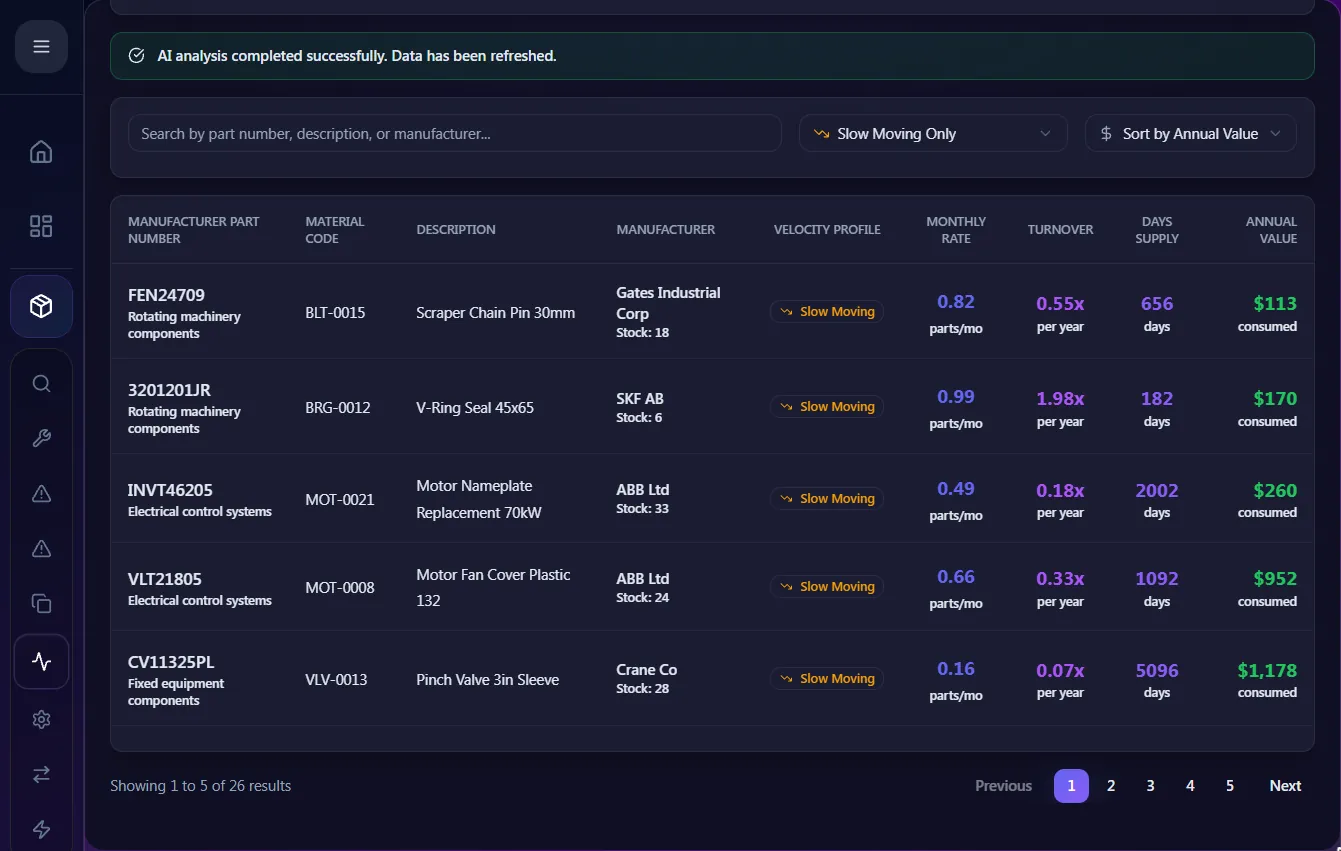
Slow movers ranked by value tied up

Sort slow and non-moving parts by annual value, days of supply and turnover to see where capital is trapped first.

  • Filter by velocity profile
  • Sort by annual value
  • Feeds reorder points and forecasting
MRO360 screen: Slow movers ranked by value tied up

Planners route every flagged part.

Your team sets the velocity thresholds, so 'slow' means what it means in your operation. Criticality is always read alongside velocity.

Velocity agent94 parts haven't moved in the analysis period

  1. ProposedAI recommendation with its reasons
  2. In reviewChecked and edited by your team
  3. ApprovedSigned off by a named approver
  4. Written backSent to the ERP field it belongs in

Velocity decides what happens next.

Non-movers go to Obsolete Check, surplus is offered to other plants, and max levels come down so the excess doesn't rebuild.

Reads goods movements at every plantYour ERP and CMMS
Classifies and values every SKUStock Velocity
Sends non-movers for a status checkObsolete Check

Further reading on slow moving inventory and dead stock analysis

Questions about slow moving inventory and dead stock

How are fast, slow and non-moving defined?

By default, fast-moving parts move 10 or more units a month, slow movers fewer, and non-moving parts none in the period. You can change the criteria.

Won't this flag our critical insurance spares?

Velocity is read alongside criticality. A critical spare that rarely moves is protected; a non-critical part that hasn't moved is flagged for disposition.

How quickly can we get a dead-stock number?

From one ERP extract, in days. That is what the free inventory diagnostic delivers.

Find out what your storerooms aren't using.

Send material master and goods movement extracts. We classify every SKU and put a dollar value on what hasn't moved.

Material master + goods movements
Non-moving valueSlow moversProtected criticals
  • Every SKU classified fast, slow or non-moving
  • The dollar value of what hasn't moved
  • Critical spares kept out of the clean-up

Size my dead stock

Free diagnostic. Findings within days of receiving the extract.

Request received. Pick a time for your kickoff call.

A short call with an MRO specialist. We'll also email a secure link for your extract.

Open the calendar in a new tab

Book A Demo

MRO Master Data Management for a leading $12Bn Oil and Gas company

Oil and Gas organizations face huge unwanted costs in the form of losses, penalties and compensation due to industrial accidents, taking a sizable chunk of their revenues. One of the important reasons for failures and accidents is the breakdown of key industrial infrastructure arising from ineffective management of the material base and inefficiencies in the MRO supply chain that are highly critical for the production and maintenance cycles.

More and more organizations are now looking to establish Master Data Management (MDM) implementations in order to manage their assets through informed decision-making based on reliable data and ensure optimal industrial safety across the enterprise.

About the company:

This US based company is a global leader in providing essential mechanical components for both land and offshore drilling rigs, complete drilling and well servicing rigs, as well as a comprehensive range of tubular inspection, internal coatings, drill string equipment, lifting and handling gear, and downhole drilling tools. It also offers supply chain services through distribution centers strategically located near major drilling and production sites worldwide. With over 800 manufacturing, sales, and service centers globally and annual revenues exceeding $12 billion, the company delivers customer-focused solutions tailored to meet the energy industry’s quality, productivity, and environmental needs.

Material Master Data Challenges

The company faced significant challenges with their master data.
• Lack of consistency and standards for the master data
• Incorrect, incomplete, unclassified and outdated attribute fields of master
data High volumes of data in multiple languages
• Multiple ERP and other legacy instances across the company
• Poorly structured material descriptions
• Lack of data governance and collaboration across cross-functional divisions and locations

Solution & Results Achieved

Solution: Material Master Data Harmonization & Ongoing Maintenance

The company implemented Verdantis Material Harmonize to cleanse and enrich its historical material master data. Using AI-powered tools and the Verdantis Content Repository, the solution classified, standardized, and eliminated duplicate materials.

Once the data was harmonized, Verdantis Material Integrity was deployed for ongoing data governance. It ensured continuous data accuracy through real-time validation, AI-driven classification, and duplication prevention, maintaining high data quality across enterprise systems.

Key Actions Taken:

  • Classified 150,000 materials into 1,210 UNSPSC and 500+ HTS codes
  • Parsed and normalized unstructured material attributes
  • Eliminated duplicates and enriched material descriptions
  • Established real-time data governance and approval workflows
  • Created a centralized repository for cross-functional data access

Results Achieved:

  • Improved Data Accuracy – Eliminated duplicate and inconsistent material records
  • Enhanced Classification – Standardized materials with UNSPSC & HTS codes
    Better Inventory Management – Optimized stock visibility and usage
  • Faster Procurement & Compliance – Enabled seamless material search & regulatory adherence
  • Sustainable Data Governance – Ensured ongoing accuracy with AI-driven maintenance
  • Informed Decision-Making – Centralized data repository for improved operational efficiency

By integrating Material Harmonize & Material Integrity, the company achieved a scalable, AI-powered Master Data Management framework, ensuring long-term data consistency, efficiency, and compliance.

Your data is secure and used solely for intended purposes. We prioritize your privacy and protect your information.