FMEA: The Foundation of Reliability Engineering
For decades, industrial enterprises have sought a systematic way to predict, prevent, and mitigate operational failures.
The sheer cost of unplanned downtime in asset-intensive industries often running into millions per hour demanded a proactive approach to maintenance and inventory management strategy.
Ironically, any attempt at mitigating these challenges had a counterintuitive effect that manifested itself in the form of excess inventories, leading to wastage, challenges with obsolescence of parts and/or assets.
This need for reliability gave rise to structured analytical methods, that also attempted to capture subjective aspects like criticality, the most enduring of which is the Failure Mode and Effect Analysis (FMEA)
Brief History and the Need for FMEA
It is generally agreed that the concept of FMEA was formalized in the U.S. military in the late 1940s under a procedure referred to as MIL-P-1629.
It was designed to ensure that potential equipment malfunctions and their resulting effects were systematically considered during the design and development of military systems.
Its success in high-stakes environments, the Apollo space program being the best example, cemented its place as a cornerstone of quality and reliability engineering.
Why the Idea Makes Sense
FMEA is powerful because it enforces a rigorous, team-based discipline. It compels engineers and maintenance professionals to ask three fundamental questions about every component or process step:
"How can this machine fail?"
Identifies the specific way a component ceases to perform its intended function.
"What are the consequences of this failure?"
Maps the failure to a business-level outcome: lost production, safety hazard, environmental impact.
"Why would it fail?"
Traces the root cause, material fatigue, process deviation, supplier quality, to enable targeted prevention.
By imposing this structure, FMEA moves criticality assessment from guesswork to a documented, auditable process, which was a monumental leap forward for managing complex machinery and industrial operations.
The FMEA Process: Calculation and Practice in Enterprises
At its core, FMEA is a qualitative and semi-quantitative method that assesses the Risk Priority Number (RPN) for each potential failure mode.
This RPN is the mechanism by which enterprises prioritize their maintenance and inventory efforts.
How is it Calculated in Practice at Enterprises
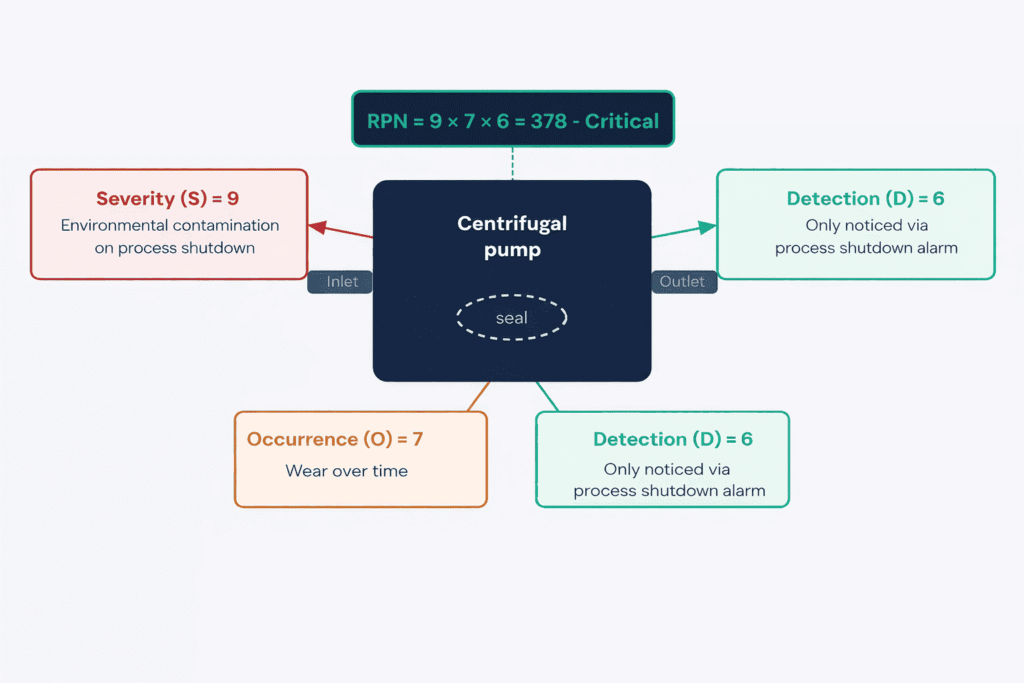
The RPN is the product of three separate scores, typically rated on a scale of 1 to 10:
The RPN Formula
In practice, a cross-functional team from Maintenance, Operations, and Engineering scores each factor. The resulting RPN then dictates priority of mitigating actions: changing the design, revising maintenance schedules, or stocking a spare part.
Some Examples and Nuances to this Approach
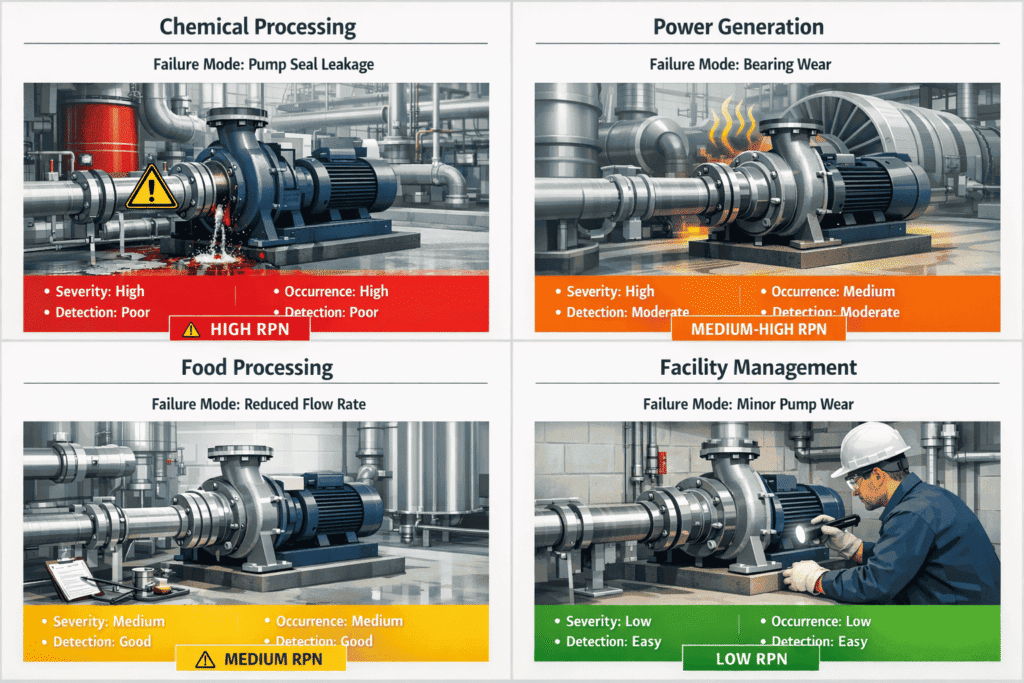
- High RPN: A pump seal failure (High Occurrence) that leads to environmental contamination (High Severity) and is only noticed by a process shutdown alarm (Low Detection score, meaning the detection method is poor). This requires immediate, high-priority action.
Low RPN: Consider a warehouse lighting fixture failure. While bulbs may occasionally fail (Moderate Occurrence), the operational impact is minimal because lighting can be quickly restored (Low Severity), and failures are easily identified during routine inspections (Good Detection).
Consider a centrifugal pump seal in a chemical processing plant. The table below walks through a real-world FMEA exercise across three different failure scenarios:
| Component | Failure Mode | Effect | S | O | D | RPN | Priority |
|---|---|---|---|---|---|---|---|
| Pump Seal | Leakage due to wear | Environmental contamination; production shutdown | 9 | 7 | 6 | 378 | Critical |
| Impeller | Cavitation erosion | Reduced flow rate; gradual performance loss | 6 | 5 | 4 | 120 | Medium |
| Bearing Housing | Overheating from lubrication failure | Bearing seizure; unplanned downtime | 8 | 3 | 5 | 120 | Medium |
| Coupling | Misalignment-induced fatigue | Vibration; minor efficiency loss | 4 | 4 | 3 | 48 | Low |
| Motor Windings | Insulation breakdown | Motor failure; full production loss | 10 | 2 | 2 | 40 | Low |
FMEA is applied to both Design (D-FMEA), focused on product or asset design, and Process (P-FMEA), focused on manufacturing or maintenance processes. For asset-intensive operations, the focus is typically on the failure of the asset itself, directly feeding into asset criticality assessment and, by extension, MRO inventory strategy.
FMEA's Positive Impact in Industrial Maintenance Environments
FMEA fundamentally helps asset-intensive operations by linking a potential mechanical failure to a business-level consequence, such as loss of production, safety hazard, or increased cost.
It focuses limited maintenance resources on the highest-risk equipment and failure modes. Reliability experts & Maintenance professionals can easily prioritize the maintenance schedules when mathematically expressed across thousands of assets and spare parts
It drives the creation of robust preventive and predictive maintenance tasks. Institutionalizing a practice like this also enforces clean documentation, auditing and justification for prioritizing maintenance and asset management tasks.
It is one of the primary inputs for determining MRO (Maintenance, Repair, and Operations) spare parts criticality. Critical parts, identified through high-severity FMEA scores, are the ones that must be stocked with aggressive safety stock levels to prevent costly downtime.
Replaces tribal knowledge and gut-feel decisions with a standardized, auditable process, critical in regulated industries like aerospace, pharmaceuticals, and oil & gas.
Who Owns the FMEA Process?
In practice, ownership of FMEA is distributed across three functions, each contributing a distinct perspective on criticality:
Executes the analysis and owns the resulting maintenance plans. Brings a technical lens to failure likelihood based on field history and engineering judgment.
Provides context on the severity of downtime and its production impact. Typically owns the S-score and represents the business consequence of a failure.
Governs the documentation and standardization of the FMEA process across the enterprise, ensuring consistency of scoring across plants and lines.
Due to the complex nature of enterprise operations, understanding the exact owner (and key stakeholders, influencers) of the process is tricky, but generally speaking, it’s safe to assume that the above stakeholders are generally involved and champion these initiatives.
Related Methodologies
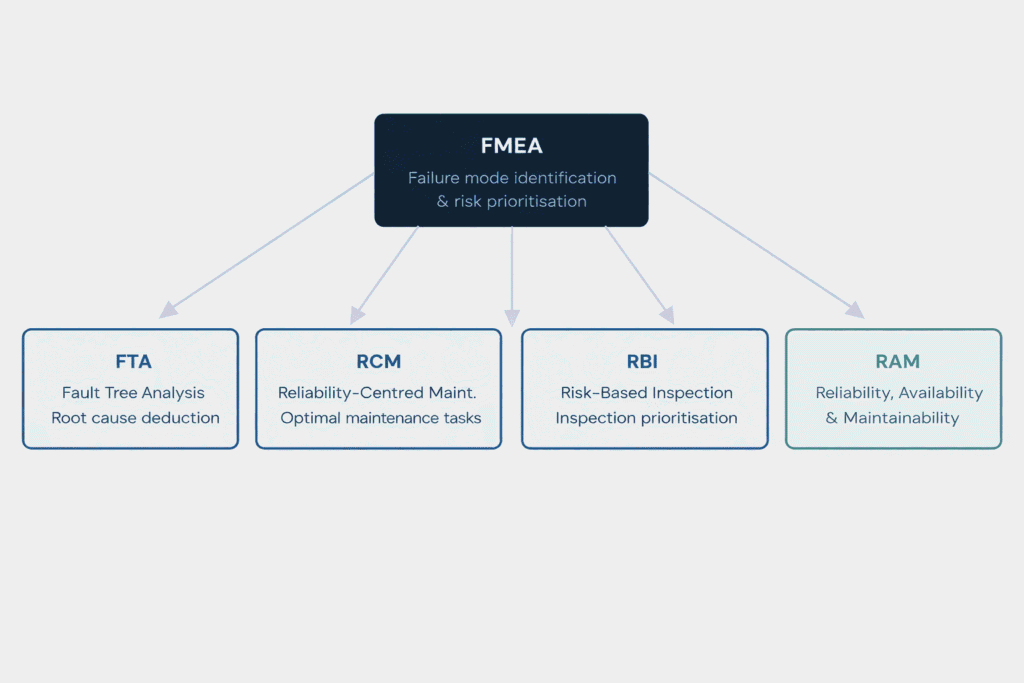
FMEA assessments are rarely conducted in a vacuum. It often works in conjunction with other reliability and maintenance methodologies, not necessarily linked to Criticality studies, but important nonetheless
Fault Tree Analysis
A top-down, deductive method used to determine the root causes of a known failure. Where FMEA asks “what can go wrong?”, FTA starts with a failure and asks “why did it happen?”, complementary approaches to the same challenge.
Reliability-Centered Maintenance
A holistic methodology that uses FMEA as a core input to develop an optimal maintenance program based on the functional failure of assets. RCM determines what maintenance tasks are necessary; FMEA tells you why they are.
Risk-Based Inspection
Prioritizes inspection activities based on the consequence and likelihood of equipment failure, closely related to FMEA principles but tailored to static equipment like pressure vessels, piping, and tanks in process industries.
Reliability, Availability & Maintainability
Popular Critiques & The Unintended Consequences FMEA
While FMEA provided a necessary structure, its reliance on the RPN calculation has become its most significant limitation in the era of AI and multi-variable data analysis.
The core issues are that FMEA is rudimentary, human-centric, and static assessment that doesn’t account for the nuances of complex maintenance and production operations.
Two entirely different failure scenarios can yield the same RPN, and nothing in the formula tells you which one to act on first.
The RPN Fallacy
The RPN Fallacy (Axiomatic Flaw): A fundamental mathematical flaw exists where two entirely different scenarios can result in the same RPN.
For instance, a failure with S=10, O=1, D=1 (RPN=10) is given the same priority as S=1, O=10, D=1 (RPN=10).
The team may prioritize the high-occurrence, low-severity issue over the rare, catastrophic one simply because the numbers are the same, leading to a misallocation of resources.
Weighting of the individual parameters may help slightly with prioritization but this is likely to have a spillover effect that may dilute the rating reliability of assessments done for other fixed assets/spare parts.
Subjectivity and Data Scarcity: The three RPN scores are often based on team consensus and tribal knowledge, not objective, real-time data.
This subjectivity leads to inconsistent criticality scores across plants or even within the same plant, making global inventory optimization impossible.
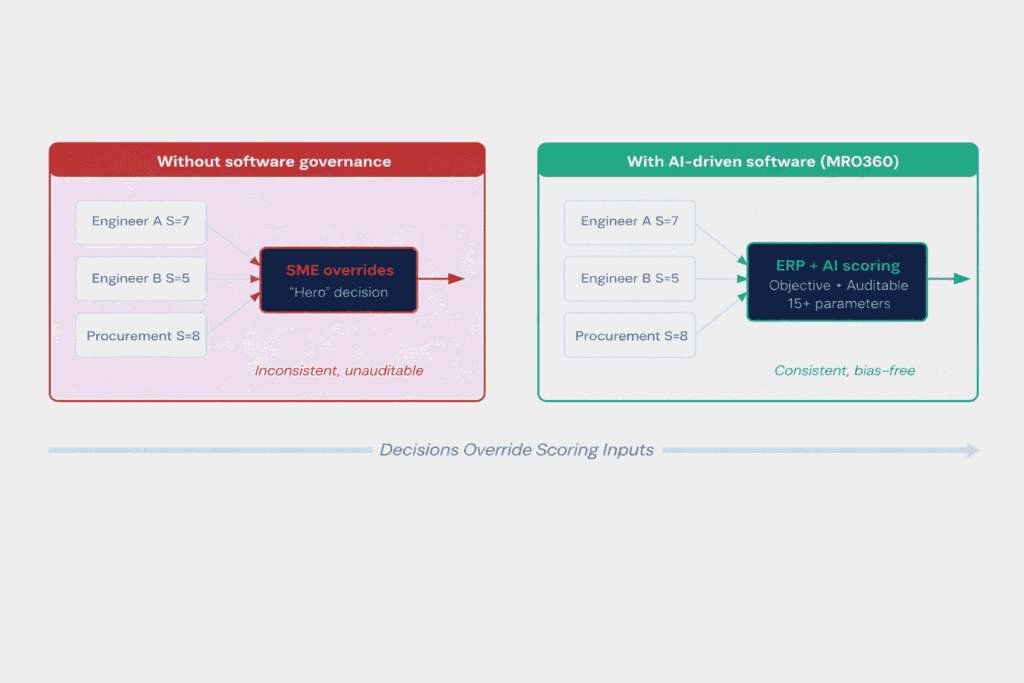
This issue is further exacerbated with conflicting teams (Maintenance wants to Overstock, Procurement wants to control Overspending) and the “Hero” effect, wherein one final decision maker or subject matter expert overrides the scoring, despite other critical indicators.
Static Assessment: FMEA is typically conducted once and rarely reviewed. It fails to account for dynamic factors:
- Real-time production scheduling (e.g., the asset is more critical today because it’s on a high-priority production run).
- Changing supplier lead times (a non-critical part becomes critical if its lead time jumps from 2 weeks to 9 months).
- Fluctuations in spare part substitutability (a part is only critical if no alternative is available).
Over 80% of industrial businesses experienced unplanned downtime in the last three years, with each incident lasting an average of four hours, suggesting that despite widespread FMEA adoption, critical failures continue to be missed. Siemens, True Cost of Downtime 2024
The Consequences of Inaccurate Assessments
In MRO inventory, this flawed criticality leads to a two-fold, costly problem:
High-risk assets deemed ‘medium-risk’ by a subjective RPN cause catastrophic downtime when they fail, resulting in millions in lost production.
This is the single most detrimental impact for industrial activity, simply due to the prohibitively high losses linked to any “downtime” related instance.
Other consequences can also include severe degradation of the environment or worker safety due to asset-failure (say a Pump or a machine that uses Hazardous materials) linked directly to leakages, spills, uncontrolled emissions, or mechanical incidents that can expose personnel to unsafe operating conditions.
– Low-risk parts with an artificially high RPN result in excess inventory, leading to significant capital being tied up in dead stock, a direct and unnecessary drain on working capital.
– Holding every maintenance related stock item like spare parts or consumables in the inventory will be associated with an inventory cost, these costs can be bucketed into:
- Inventory Capital Costs: The capital tied into the inventory itself is an Opex cost component, every $ overspent at any given point in time towards parts that aren’t being utilized are cost centres that shouldn’t be ignored
- Store Room Management: These are all the costs associated with the, While technically a fixed cost,
- Logistics-Related Overheads: These are all the costs associated with the movement, handling, and distribution of materials across the supply chain.
The practical consequence is a maintenance organization perpetually fighting on two fronts, scrambling to source critical parts at premium emergency prices while simultaneously managing a bloated warehouse of stock that will never move.
Modern Criticality Assessment: Moving Beyond FMEA
Criticality assessments at most enterprises are part of a broader overhaul of spare parts management.
The qualitative portion of the assessment is largely an alignment exercise, subject matter experts across functions weigh in on scoring, after which an EAM or CMMS calculates and stores scores across assets. This aids prioritization across facilities and production lines.
With the continuous evolution of AI and data integration, today’s criticality processes can be significantly more accurate, objective, and contextually aware.
The table below compares the traditional FMEA approach with a modern, AI-assisted criticality methodology:
Improvising on FMEA for Maintenance Excellence
Typically, criticality assessments at enterprises are part of a broader overhaul of the spare parts management process and prioritization of maintenance activities.
The qualitative portion of the assessment itself is more of an “alignment” exercise where several subject matter experts across different functions weigh in on the scoring.
After which a software solution, typically an Enterprise Asset Management Software or a CMMS system, calculates and stores this information across several fixed assets. This aids prioritization of maintenance activities across different production facilities and even production lines.
For completion of the MRO Inventory management cycle, there’s another step involved, forecasting the consumption and demand of spare parts depending on the production volume.
This, coupled with the criticality scores, helps identify the buffer and safety stock that needs to be maintained and helps establish the reorder point for that spare part.
With the continuous evolution of these technologies, today the processes of criticality assessments, inspired from FMEA, can be much more accurate, objective, and contextualized based on the complex nature of industrial operations.
This improvises on the known drawbacks of a static, subjective, and rudimentary assessment like FMEA, while also incorporating the best practices from that framework.
And that’s precisely what we’ve done with MRO360, Verdantis’ flagship solution for Spare Parts Management with built-in plug-and-play modules for criticality studies.
Criticality Parameters
The criticality parameters in the assessments additionally take into account several factors like supplier lead time, history of that asset failure, proximity of another plant location with a similar asset, interoperability of spare parts, and 15+ additional parameters.
Agentic AI Workflows
A subjective assessment can now be made objective with Agentic systems trained in industry-specific data, enterprise context, failure history of known assets, and the ability to map obsolete assets and spares.
Apart from the obvious benefits of improved productivity and quicker turnaround, this approach also takes advantage of cutting-edge technologies, publicly available information, and information from private studies that Verdantis has access to.
Learned Context from ERP Data
One of the most competitive advantages of a solution like this is the deep integrations with ERP systems. Typically, MRO360 integrates with 20+ tables across core ERP modules. This is precisely what makes the Agentic system so powerful, equipped with accurate information like:
The exact location of every single spare part, whether in-transit, in a specific storeroom, or at the production site.
Historical lead times from preferred suppliers for every single spare part, enabling accurate safety stock calculations.
Deep integrations across core ERP modules ensuring the Agentic system operates on complete, reliable, and technically accurate enterprise data.
Historical work orders that create a digital map of likely failures, past part replacements, and information from predictive maintenance systems.
FMEA has achieved near-universal adoption across asset-intensive industries. In several sectors, its use is not merely a best practice, it is a regulatory or certification requirement.
| Industry | Governing Standard / Driver | Primary FMEA Focus | Criticality of MRO |
|---|---|---|---|
| Automotive | IATF 16949 (mandatory) | Design & process FMEA for all components | Very High |
| Aerospace & Defense | SAE ARP4761 / MIL-STD-1629A | Safety-critical systems; fault trees | Very High |
| Oil & Gas | API 580 / ISO 31000 | Asset integrity; risk-based inspection | Very High |
| Pharmaceuticals | FDA 21 CFR / ICH Q9 | Process FMEA for GMP compliance | High |
| Power Generation | NERC CIP / IEC 61511 | Critical asset identification; grid reliability | High |
| Food & Beverage | FSMA / HACCP | Process FMEA tied to food safety plans | Medium |
| Mining | Site-specific / ISO 55000 | Equipment reliability; fleet management | High |
It would not be an exaggeration to say that the introduction of FMEA has been a welcome move by industry-professionals and is currently widely accepted globally.
Frequently Asked Questions (FAQs)
What is the difference between FMEA and FMECA?
FMECA (Failure Mode, Effects, and Criticality Analysis) is an extension of FMEA that adds a formal criticality analysis step. While FMEA ranks failures by RPN, FMECA goes further by classifying each failure mode into a criticality category based on its probability and severity, useful in aerospace and defense where binary criticality classifications are required by regulation
What is a "good" RPN score?
There is no universal threshold, and this is one of FMEA’s known weaknesses. Common practice sets action thresholds at RPN ≥ 100 or ≥ 200, but these are arbitrary. The more meaningful approach is to rank all failure modes from highest to lowest RPN and focus resources on the top tier, regardless of the absolute number. Always pay special attention to any failure mode with a Severity score of 9 or 10, even if its overall RPN appears low.
How often should FMEA be reviewed or updated?
Best practice is to review FMEA whenever there is a design change, a process change, a new failure mode discovered in the field, or a significant shift in operating context (new production schedules, new suppliers, new regulatory requirements). At minimum, a periodic review every 12–24 months is recommended. Modern AI-driven criticality tools address this by updating scores dynamically as ERP and EAM data changes.
What is the difference between FMEA or RCM?
FMEA is an analysis tool, it identifies failure modes, their effects, and risk levels. RCM (Reliability-Centered Maintenance) is a decision-making framework that uses FMEA outputs to determine the optimal maintenance strategy for each asset. In practice, RCM uses FMEA as its primary input: the failure mode analysis feeds directly into the selection of preventive, predictive, or run-to-failure maintenance tasks.
How does FMEA connects to MRO spare parts stocking decisions?
The Severity score in FMEA is the most direct link to MRO stocking strategy. A high-severity failure mode, particularly one involving safety, environment, or total production loss, typically signals that the associated spare part must be stocked on-site with defined safety stock levels. The Occurrence score informs reorder frequency, while Detection scores may influence whether condition-monitoring sensors are a better investment than holding physical stock. Modern MRO platforms like MRO360 automate this linkage by ingesting FMEA criticality scores alongside ERP data to generate optimized stocking recommendations.
Can FMEA be used for software or process failures, not just hardware?
Yes. Process FMEA (P-FMEA) is widely used in manufacturing processes, administrative workflows, and software development lifecycles. Software FMEA analyzes potential failure modes in code, systems, and integrations, particularly relevant in safety-critical embedded systems. The methodology is the same; the failure modes shift from mechanical (seal wear, bearing fatigue) to functional (data corruption, logic errors, API timeouts).