


Unplanned downtime remains one of the most costly challenges in asset-intensive industries. A Siemens survey found that unplanned downtime costs big companies 11% of their revenues. Accumulatively, that totals to around $1.4 trillion annually.
Imagine this downtime going on for hours or an entire day at your organization. It would cost you millions of dollars. While many companies try to resolve these issues, they persist because the focus is on solving the immediate problem.
Root Cause Analysis (RCA) addresses this gap through a structured, data-driven approach. It allows professionals to move from the cycle of reactive maintenance to proactive upkeep. In this guide, you will explore everything about RCA, from what it is to how it is applied, especially in asset-intensive environments.
What is Root Cause Analysis (RCA)?
Root cause analysis is a structured process of identifying the underlying cause of failures. Instead of looking at the surface-level problem, it enables you to go beyond and examine what’s causing it to prevent the same issue from occurring again.
Consider a food and beverage manufacturing plant that frequently experiences production line stoppages during bottling. Let’s say that the maintenance team restarts the line each time the failure occurs. This resumes the production line, but the issue keeps arising every few days. At first, this will appear as a simple mechanical glitch. However, conducting RCA could reveal the underlying problem.
For instance, when the maintenance team leverages RCA, they could uncover that the problem is not within the machine. Instead, it is because of inconsistent bottle dimensions from a specific supplier batch. This results in misalignment in the filling and capping process, leading to automatic shutdowns to prevent defects.
Here, the maintenance team initially focused on machine performance, the engineering team identified tolerance mismatches, and the procurement team traced the issue back to supplier variability with the help of root cause analysis.
Effective RCA enables companies to:
- It lets them reduce repeat failures
- Enterprises can enhance asset reliability while bringing stability to all operations
- Improve maintenance planning
In maintenance and operations, it focuses on determining the chain of events and contributing factors that lead to equipment breakdowns, process deviations, or quality issues.
There are many aspects of it, from analyzing failure data to checking maintenance history. They all help trace back issues to their origin. While the primary focus is on resolving problems, root cause analysis matters beyond it. It is about long-term reliability through the systematic fixing of issues.
Here are some examples of how useful root cause analysis can be:
| Failure mode | Immediate Cause | Root Cause | Corrective Action |
| Bearing failure | Overheating | It was an inadequate lubrication schedule that was causing overheating | The manager can revise preventive maintenance intervals to prevent this |
| Seal leakage | Material degradation | The management team was choosing the wrong material based on the operating conditions | Change the material and update the part specification |
| Motor trip | Electrical overload | The load was not being distributed appropriately | Businesses can rebalance system load |
Beyond equipment breakdowns, RCA is applicable to process inefficiencies and supply chain issues, too. Sometimes, these failures can overlap. For instance, process inefficiencies can lead to equipment failure and impact the supply chain. Root cause analysis provides the right framework to connect them and identify the true source of the problem.
Common RCA Methodologies Explained
Root cause analysis can be conducted using multiple methodologies and approaches, including the following:
The 5 Whys Technique
As the name suggests, this method is all about asking “Whys,” particularly 5 times. It lets you drill down to the root cause of a problem by asking “why” repeatedly until you get to the bottom of the issue. Answers to all these whys will let you interrelate data to create a clear picture of the underlying problem.
Although a straightforward approach, it can be effective when applied with disciplined questioning and data validation. For instance, each of your answers to the “why” should be backed by historical data, inspection records, maintenance plans, and operating conditions.
A simple example is that Verdantis helps you identify the underlying cause of bearing failure. Verdantis tools can help you maintain log data for every asset, spare part, work order, and more. You can use this to ask relevant questions to determine the potential issue. In that case, here are the five questions and responses you can find:
- Why did the bearing fail? -> Because of excessive temperature recorded (sensor data)
- Why was the temperature high? -> Lubrication breakdown (inspection report)
- Why did lubrication fail? -> Grease started to degrade beyond the interval (PM logs)
- Why was the interval exceeded? -> PM schedule not triggered (CMMS gap)
- Why was it not triggered? -> Incorrect asset hierarchy configuration prevented it
Since this is a very simplified way of looking at failures, it works best for standard issues where multiple factors don’t interact simultaneously.
The best case to use this method is when the failure path is straightforward, and you need a quick root cause. For instance, you can use it in cases of repeated bearing failures due to missed lubrication schedules, conveyor motor overheating linked to improper load handling, or valve leakage caused by improper seal installation.
Fishbone Diagram
Also known as the Ishikawa or cause-and-effect diagram, this method works by categorizing causes of a problem into multiple sub-causes. It can be materials, manpower, methods, environment, measurements, or any other sub-cause. The name of this method is derived from its structure, which is a fishbone. Additionally, Kaoru Ishikawa pioneered the concept. Hence, the alternative name.
It goes beyond linear thinking by enabling you to categorize different contributing factors from multiple domains.
The Fishbone diagram RCA methodology is best suited for multi-factor problems. It can be a scenario where your maintenance and procurement teams would have to work together to brainstorm the root cause. A straightforward example will be pump seal failures involving material quality, installation, and operating conditions. Similarly, you can also use it when boiler inefficiency is linked to fuel quality, maintenance gaps, and environmental factors.
Fault Tree Analysis
Similar to the fishbone diagram, the name of the fault tree analysis is derived from its structure. It is a deductive, logic-based method that models how multiple failures combine to produce a top-level event.
You should use this method when analyzing the root cause of system-level failures. It works best for such scenarios, as it breaks high-level issues into contributing lower breakdowns.
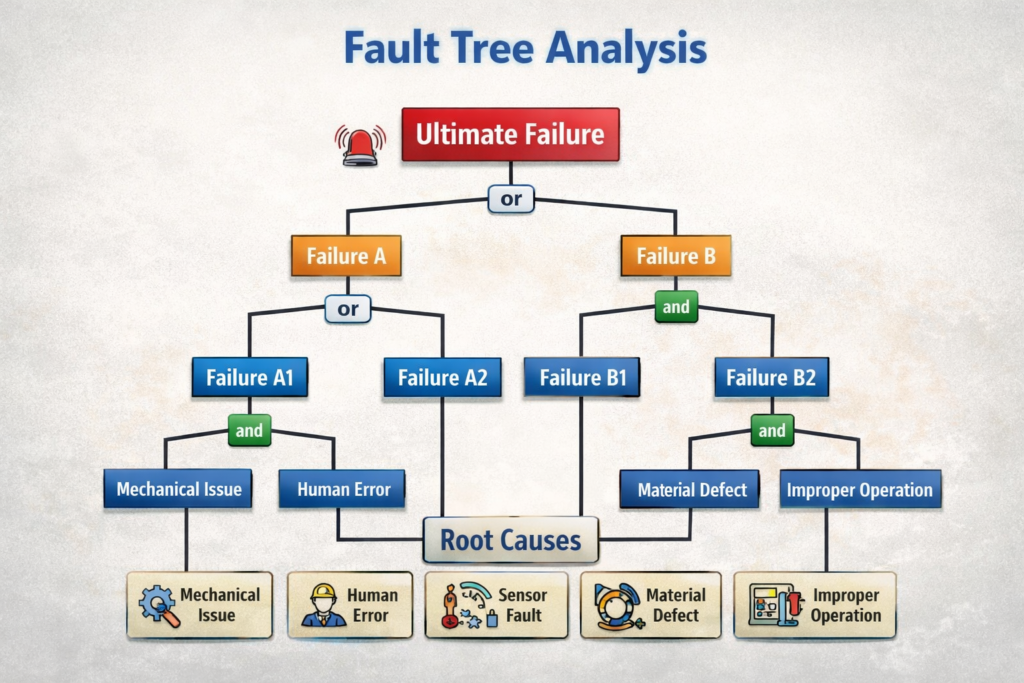
This method uses Boolean logic. For the OR gate, any input could cause the failure, whereas for the AND gate, all inputs must occur simultaneously. This logic allows quantification of failure probability when failure rates are known.
Here’s an example:
Top event: Compressor shutdown
Mechanical failure (OR)
Bearing failure
Rotor failure
Control failure (AND)
Sensor fault
Control logic error
Fault tree analysis is best suited to identifying the root cause of complex system failures. They are useful when failures involve interdependent systems and require logical mapping. Examples include HVAC system failure, compressor shutdown, turbine trip triggered, etc.
Failure Modes and Effects Analysis (FMEA)
Instead of reacting to a problem, this method is about proactively looking for potential failures. FMEA is commonly used to determine failures within a particular system. Thus, businesses apply this methodology to conduct RCA whenever a new process or product is introduced. As a proactive method, FEMA also prioritizes risks and prevents issues by estimating their severity or likelihood.
Besides that, it determines how often a failure occurs and what steps you should take to prevent it. It also identifies the actions that were effective in preventing the failure from recurring. FMEA is particularly useful when integrated with reliability metrics such as mean time between failures (MTBF) and failure distributions.
FMEA is best suited for scenarios where there are multiple failures and risk prioritization is required. For instance, when you want to evaluate failure risks of critical spare parts or equipment, you can rely on FMEA.
Pareto Analysis
The name of this methodology derives from the Italian economist Vilfredo Pareto. It is a simple bar chart that represents failure data based on descending order of occurrence or impact. Thus, this root cause analysis methodology helps identify the most significant issues among them. Collectively, these issues can provide a clear picture of the most recurring failures and how they correlate with each other.
For example, input data such as downtime contributions by asset, maintenance costs per failure, and numbers of failures by type can generate insights, such as 20% of assets account for 75% of downtime.
Such insights enable the management team to focus root cause analysis efforts where they can deliver the greatest impact. To add to that, they can even track the progress by monitoring how a bar shortens over time.
Consider the scenario where you are conducting an RCA to understand maintenance cost analysis across spare parts used in equipment for your mining business. You will analyze the past 12 months of data for this. Upon the analysis, you find out these patterns:
- Bearings are causing 35% of failures
- Seals cause 25%
- Filters cause 15%
- Others cause 25%
Here, the insight is that bearings and seals account for 60% of all failures. Based on this, you will know where you need to focus your RCA efforts.
Pareto analysis is for high-frequency or high-risk issues. For instance, suppose a conveyor belt breaks down regularly. In this case, multiple spare part problems could be contributing to it. However, you would want to know which spare part contributes most to the downtime. Similarly, when determining top failure causes across multiple assets or analyzing maintenance costs by equipment type, Pareto analysis becomes useful.
Scatter Plot Diagram
Think of a scatter plot as a two-dimensional graph. Various dots are used to represent the values of different numeric variables. Where they are positioned on the X and Y axes shows the relationship between two variables. The representation enables organizations to visualize correlations between causes and effects.
You can also use scatter plots with regression analysis to quantify relationships. Some examples where this RCA methodology can be used include determining relationships and comparisons between vibration amplitude and bearing failure rate, or between load and motor temperature.
The scatter plot diagram methodology is best suited for correlation analysis. A typical use case will be linking supplier batches to failure rates or load vs failure trends. You can choose this option when you suspect a relationship between variables but need data validation.
Connecting RCA with CMMS and Work Order Data
Root cause analysis in asset-intensive environments, such as mining, utilities, and oil & energy, requires high-quality data support. However, gathering and leveraging quality data is a significant challenge for many businesses.
According to our survey of 1,900 senior executives across these industries, 51% highlighted data-quality issues in MRO operations. Additionally, 49% cited inconsistencies in supplier master data.
A reliable Computerized Maintenance Management System (CMMS) serves as the primary data backbone for root cause analysis through reliable supplier master data. RCA effectiveness depends directly on the quality, structure, and completeness of maintenance data captured in the CMMS.
For instance, a CMMS can provide data such as asset hierarchies, maintenance logs, failure coding systems, failure history tracking, and more. It also structures all this data to ensure it is ready for RCA.
The table below maps the relationship between CMMS data and RCA outcomes:
| CMMS Data Field | Example | RCA Relevance | Insights Generated |
| Asset ID | Pump – 102 | It identifies the failure location | This helps track failure frequency and clustering |
| Failure code | Seal Leak | Failure classification is standardized | It enables pattern recognition |
| Work order notes | Seal worn unevenly | Businesses get contextual evidence with this | This data supports hypothesis validation |
| Downtime duration | 3.5 hours | Data represents the impact of failure | Helps prioritize critical failures |
| Maintenance type | Corrective | Indicates maintenance strategy | Highlights reactive trends |
Without this structured data, root cause analysis becomes anecdotal rather than analytical.
Within a CMMS, work order data is the most useful and actionable for RCA. It captures not just what failed but how the failure was addressed. This historical data forms the foundation for root cause analysis of frequent failures.
In fact, it can also enable automation in RCA. For example, management can set triggers to automate it based on the number of failures, which data to use, etc. So, every time CMMS records a failure of a particular piece of equipment for the 5th time, for example, it will trigger an automated root cause analysis.
Besides helping with automation, CMMS integration also provides a roadmap for putting RCA insights to use with maintenance planning. When the root cause is identified, managers can embed the findings into maintenance execution.
For example, they can optimize preventive maintenance, job plans, and asset strategy refinement. They can also align relevant spare parts with MRO processes for quick maintenance.
How RCA Brings Together Different Departments
One of the biggest challenges in understanding the root cause in an asset-heavy industry is the cross-departmental blame.
Consider a simple example of a manufacturing plant where failure occurs at an automation line. Here, most would think that it is because of either automation (IT team) failure or mechanical failure. To address the problem, the maintenance team would monitor the automation line’s performance, and the IT team would review the code to prevent the issue from recurring.
Here, the blame game would start. The IT team may blame the maintenance guys for not doing their job, and vice versa.
However, root cause analysis spanning across different departments would reveal a different picture. For instance, the maintenance team could find regular sensor failures. To add to that, the engineering team might find out that there is no design flaw, but the system’s sensitivity is high.
More insights can come from the procurement team, revealing that the sensors sourced this time were from a new supplier with some specification variances. Based on this addition from the supply chain team, the IT team may find that the control system was not updated recently to reflect the revised tolerance thresholds.
This would signal that changes are required across all these departments. Once these changes are made, the operations team will be able to speed up production and meet the demand.
RCA encourages brainstorming together rather than creating isolated assumptions. This provides a structured approach for different teams. Be it a supply chain manager, an IT department executive, a maintenance person, or an operations manager, everyone can come together to solve the issue quickly.
The Role of AI in Modern RCA
Traditional manual RCA approaches rely heavily on manual investigation, expert judgment, and limited datasets. This procedure could still be effective for isolated or simple failures. However, they face constraints in MRO because failures are influenced by multiple variables here.
Artificial Intelligence (AI) can bridge this gap with large-scale pattern recognition and automated correlation across diverse data sources.
AI models can analyze historical work orders, sensor readings, and failure records to identify relationships among failure-causing variables. This offers a quicker and more accurate path to identifying the root cause of a breakdown or failure. With quality data to learn from, AI models can also automate the root cause analysis workflows.
What adds more value to AI-based and automated root cause analysis is integration with other technologies. It can, for example, integrate with the Internet of Things (IoT) and augmented reality to gather data from the source and create a visual representation of the same.
As this connectivity grows, AI lets you conduct predictive analysis. With constant data input and feedback, machine learning models can learn normal behavior, detect anomalies, correlate events across systems, and suggest the most likely cause of a problem before it becomes severe.
| Aspect | Traditional RCA | AI-Driven RCA |
| Data scope | Limited, sample-based | Large-scale, multi-source datasets |
| Analysis speed | Time-intensive | Automated, near real-time |
| Pattern detection | Experience-driven | Algorithm-based pattern recognition |
| Root cause accuracy | Variable | Higher with validated data models |
| Scalability | Limited to specific cases | Scalable across assets and sites |
Here’s an example to help you better understand the impact of AI. Suppose a facility experiences regular centrifugal pump failures across multiple sites. Maintenance teams have tried to solve the immediate issue by replacing impellers and seals, but failures persist. The table below shows the breakdown of how AI can help in such a situation.
| Stage | Data Source | AI-Driven RCA Outcome | MRO Impact |
| Failure detection | CMMS work orders reflect regular pump failures | The AI system will detect patterns across multiple assets and sites. | Highlights systematic issues, not isolated failures |
| Data correlation | Work orders + sensor data | Unlike traditional RCA, where your IT team must review log data to identify the cause, AI models can correlate vibration spikes with specific operating conditions. | This will identify failure triggers quickly. |
| Parts analysis | Inventory + procurement data | Manual RCA offers limited supplier comparison, but AI links higher failure rates to specific impeller supplier batches. | It flags a supplier quality issue. |
| Root cause identification | Engineering analysis | AI goes beyond focusing solely on mechanical failures to identify a combination of substandard impeller material and operating load conditions in pump failures. | You can determine the connection between parts, operations, and suppliers. |
| Action recommendation | NA | The automated RCA tool can suggest a supplier change, updated material specifications, and revised operating limits to support decision-making. | This reduces repeat failures. |
| Continuous monitoring | Periodic review and feedback | Traditional RCA only enables reactive analysis, but AI allows a proactive approach with real-time alerts when similar conditions arise. | You can engage with maintenance plans through a preventive approach. |
Business Impact of Effective RCA
When businesses conduct root cause analysis effectively, it can significantly affect their maintenance and failure rates.
Reduced Repeat Failures
Since RCA is primarily applied to MRO failures, it’s no surprise that its most measurable outcome is a reduction in repeat failures. Without root cause analysis, businesses try to solve them by replacing components. This provides a short-term solution, but the failure recurs after some time.
Lower Maintenance Costs
Maintenance costs are inflated by short-term solutions, reactive interventions, emergency repairs, and excessive consumption of spare parts. As RCA highlights the underlying problem, solutions are derived from accurate insights, which address the issue in the long term. Moreover, data-driven, automated root cause analysis shifts maintenance from reactive to planned, optimized execution.
Improved Uptime and Asset Availability
When failures and breakdowns occur, uptime increases. After the root cause of an issue is resolved, businesses enjoy better asset management and availability, which reduces unplanned downtime. Besides that, automated root cause analysis also increases mean time between failures and lowers mean time to repair to reduce maintenance costs.
Enhanced Safety and Compliance
In asset-heavy industries like oil & mining, utilities, and manufacturing, machine failure can create a hazardous work environment. For example, broken equipment can fall onto someone and result in fatal injuries.
RCA contributes to safety and compliance by:
- Identifying failure mechanisms that could lead to unsafe conditions
- Preventing recurrence of incidents through corrective actions
- Supporting documentation required for audits and regulatory reviews
- Improving adherence to maintenance protocols
Conclusion
Most organizations think of root cause analysis as just a troubleshooting tool. However, it is way more than that, as it can influence not just failure rates but also maintenance costs, uptime, asset availability, supply chain, and much more. For instance, you can integrate it with CMMS data to enable a closed-loop system where each failure can be leveraged to optimize maintenance strategies, part selection, and more informed operational decisions.
The addition of AI further strengthens this capability by analyzing data. However, it all depends on the quality and consistency of the underlying data you use for RCA.
Verdantis’s focus on material management and MRO data standardization lets you create clean, structured, and reliable datasets across maintenance and supply chain systems. This lets you analyze failure more accurately and generate stronger insights from both traditional and AI-driven RCA approaches.
Connect today to get a demo on how Verdantis can help improve the efficiency of your root cause analysis.
FAQs
How is Root Cause Analysis different from troubleshooting?
The primary focus of troubleshooting is on restoring functionality as quickly as possible. Put simply, it addresses the immediate cause of a failure. RCA, on the other hand, investigates the underlying factors that led to the failure. It eliminates recurrence by identifying systemic issues.
What type of data is required to perform effective RCA?
Various types of data can play a role in the effectiveness of RCA:
- CMMS work order history
- Failure and cause codes
- Maintenance logs
- Inspection reports
- Sensor and condition monitoring data
- Spare parts information
Incomplete or unstructured data can limit the accuracy of RCA outcomes.
Can RCA be applied in predictive maintenance environments?
Yes. In predictive maintenance, RCA is used to validate failure patterns. They can be identified through condition monitoring and analytics. It helps confirm whether detected anomalies are linked to specific root causes or not.


