


Spending on operations, maintenance, and repairs (MRO) falls within the long tail of procurement. It is transaction-heavy, dispersed, decentralized, and historically under-optimized.
The average number of MRO suppliers used by organizations has increased, with the proportion using >250 suppliers rising from 6 % to 15 % in recent indirect procurement surveys. (Source: RS Online)
This misalignment results in a structural issue. When used for MRO, traditional strategic sourcing techniques that were created for high-value, low-complexity categories fall short, resulting in issues like inflated inventory costs, hidden price variance, and excessive downtime risks.
A Technical Overview of Typical MRO-Related Spends
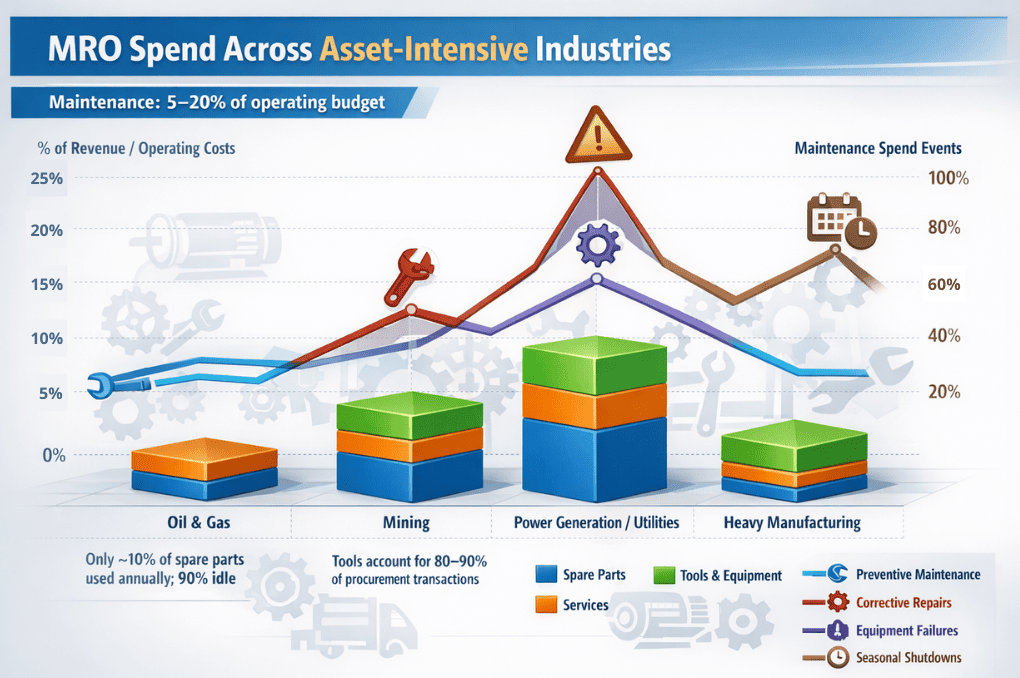
For asset-intensive businesses, maintenance, repair, and operations (MRO) costs are essential because they guarantee equipment availability, business continuity, and safety compliance.
In many facilities, maintenance expenses alone represent a significant share of the operating budget.
According to industry surveys, between 5 and 20 percent of a facility’s annual operating budget is spent on maintenance activities.
In some sectors with heavy machinery and critical assets this proportion increases further, reflecting the expense of keeping complex assets running reliably.
In the high-stakes environment of asset-intensive industries, the distinction between “MRO Spend” and “MRO Cost” is often the line between a firm that is merely surviving and one that is driving sustainable profitability.
While procurement teams often celebrate “Spend” reductions, operations teams live with the “Cost” consequences.
To achieve true operational excellence, organizations must move beyond viewing MRO purely as transactional procurement.
A more effective approach is to analyze MRO spend categories, understanding how resources are allocated across equipment, consumables, tools, and services.
By examining spend at this level, companies can identify optimization opportunities, prioritize critical assets, and develop a strategic framework that balances reliability, efficiency, and cost-effectiveness.
Spare Parts and Components
In asset-intensive industries such as oil and gas, mining, power generation, and heavy manufacturing, spare parts and components represent the most capital-intensive portion of MRO spending, including critical electrical items such as relays, motors, and sensors, as well as mechanical components like pumps, bearings, and gears.
Alongside spare parts, tools and diagnostic equipment are essential enablers of maintenance execution and are typically governed within the same MRO category, sharing budgets, storerooms, and procurement processes.
As per reports, across manufacturing sectors, MRO spending, including spare parts and services, typically ranges from 0.5 percent to 4.5 percent of annual revenues, highlighting its material impact on overall operating costs.
In environments such as offshore platforms and petrochemical plants, high equipment complexity, harsh operating conditions, and limited access to assets result in frequent part usage and a strong dependence on both spare parts and specialized tools.
Maintenance activities cannot proceed without the correct combination of materials, calibrated tools, and diagnostic equipment, making availability across all three dimensions critical.
Spare parts consumption is driven by a combination of:
- Planned preventive maintenance activities,
- Corrective repairs,
- Equipment failures, and
- Large-scale shutdowns during seasonal turnarounds.
For example, failures in critical rotating equipment often require immediate replacement of bearings, seals, pumps, or valves, leading to sudden spikes in expenditure within short timeframes.
Despite this criticality, costs in this category often escalate due to poor material master and spare parts data governance.
Identical components are commonly recorded under multiple descriptions, abbreviations, or supplier-specific SKUs across ERP systems.
A single bearing may appear as “Ball Brg 6205,” “6205-ZZ,” or a vendor part number in different plants, and under different assets.
This data fragmentation prevents accurate demand aggregation, obscures true inventory positions, and results in parallel purchasing of the same item across locations.
A further contributor to this lack of visibility is incomplete or inaccurate Bills of Materials (BOMs) at the asset level.
When BOMs are not aligned with the material master, maintenance planners cannot reliably identify which parts are truly required for specific assets or maintenance tasks.
As a result, spare parts are stocked based on experience or perceived risk rather than actual asset requirements.
Here is how our AI agent helps maintain accurate BOMs:
To compensate for this lack of visibility and uncertainty around availability, organizations tend to overstock spare parts.
Industry studies indicate that up to 90 percent of spare parts inventory may remain unused for more than a year, reflecting safety stock levels driven by data gaps rather than actual demand.
As inventory accumulates, financial impact increases through annual carrying costs of 20 to 30 percent of inventory value, which include warehousing, handling, insurance, capital costs, and obsolescence.
For instance, an energy company holding $2 million in spare parts inventory may incur $400,000 to $600,000 per year in holding costs before those parts are ever used.
Preventing overstocking of low-usage items while ensuring the availability of critical spares can be done by:
- Eliminate redundant or obsolete SKUs using last-used and lifecycle tracking in the EAM/CMMS.
- Implementing proper spare parts classification methods, (discussed in this article), like, ABC or XYZ analysis to prioritize stocking and replenishment.
- Assessing the criticality of the spare parts by various methods, and applying criticality scoring based on asset impact, failure risk, and replacement lead time.
The criticality score is usually calculated as: Impact × Failure Probability × Lead Time Factor. Each factor is scored on a fixed scale, usually 1 to 5. For example,
| Score | Impact (Business Effect) | Failure Probability | Lead Time |
|---|---|---|---|
| 1 | No production impact | Rare | < 1 week |
| 3 | Partial production loss | Occasional | 1-4 weeks |
| 5 | Full shutdown or safety risk | Frequent |
Similarly, for a mechanical seal used in a main feed pump in an oil refinery, the assessment would be as follows:
| Factor | Score | Reason |
|---|---|---|
| Impact | 5 | Pump failure stops crude feed |
| Failure Probability | 3 | Seal degrades under high pressure |
| Lead Time | 4 | Custom part, 8-10 weeks |
When a high-criticality component is unavailable, unplanned downtime follows. In heavy industries, such downtime can cost tens of thousands to several million dollars per day, depending on production throughput, contractual obligations, and restart complexity.
These losses are driven not by the unit price of the spare itself, but by weak alignment between asset criticality, maintenance execution, and spare parts strategy.
Consumables and Maintenance Supplies
Consumables such as lubricants, filters, fasteners, welding rods, and cleaning chemicals are consumed continuously during maintenance execution.
While individual items are low in value, cumulative spend becomes substantial in large facilities operating around the clock.
In practice, consumables are often procured in a decentralized manner, with maintenance technicians, site supervisors, and different shifts ordering items independently.
This fragmented purchasing behavior increases transactional volume and drives emergency and off-catalog purchases at premium prices.
Industry observations indicate that last-minute procurement of critical consumables, such as filters, can cost two to three times more than planned purchases, particularly when rush freight and supplier premium pricing are involved.
Cost escalation is further driven by limited visibility into consumable usage. Materials are frequently issued without being systematically tracked against assets, job types, or maintenance activities.
Weak work order management further amplifies this issue. Among different work order types, materials are frequently underreported or misrecorded.
This breaks the connection between maintenance activities and actual consumption, limiting the organization’s ability to analyze demand patterns, forecast requirements, and control consumables spend.
Another significant contributor is maverick buying, where consumables are purchased locally outside approved supplier agreements due to urgency or convenience.
These purchases typically incur 20 to 30 percent price premiums, include expedited shipping costs, and bypass negotiated pricing structures, eroding supplier leverage and increasing average unit costs over time.
External factors also influence consumables spending. Disruptions in global supply chains, including shipping lane constraints and logistics delays, have increased lead times for critical MRO items. As per studies,
Organizations are often forced to pay 30 to 50 percent price premiums to expedite essential consumables in order to maintain production continuity
From a data and classification perspective, consumables are frequently treated as generic stock items with minimal standardization.
This lack of consistent item descriptions prevents demand aggregation across sites and obscures the fact that, under the Pareto principle, a relatively small number of consumable families, such as industrial lubricants and filtration products, typically account for the majority of spend.
Because consumables also form part of the long tail of MRO inventories, this fragmentation increases transactional overhead and inflates inventory carrying costs when not managed centrally.
Capex Spends
CAPEX MRO costs are primarily driven by high-value fixed assets, including industrial machinery, production line equipment, heavy-duty vehicles, and other capital-intensive infrastructure.
While these costs are capitalized rather than immediately expensed, failures or suboptimal performance of these assets can significantly disrupt operations, reduce asset utilization, and increase total cost of ownership.
Extended downtime or major equipment failure can have cascading effects, including delayed production schedules, reduced throughput, and potential contractual penalties.
A major contributor to elevated CAPEX MRO spend is reactive or deferred maintenance. When fixed assets are not incorporated into systematic maintenance programs, predictive monitoring, or condition-based assessments, unplanned failures occur.
Industry analyses show that
In oil & gas and petrochemical sectors, refurbishment or overhauls of rotating equipment (pumps, compressors, turbines) can cost 25-40% of the original asset value, often recurring every 3-5 years.
Emergency interventions, such as repacing a turbine rotor, robotic arm retrofits, or large-scale structural upgrades, require expedited labor, specialized vendor support, and high-cost components, often exceeding the costs of preplanned interventions by multiples.
Furthermore, CAPEX MRO expenditures are frequently dispersed across multiple sites or business units with limited centralized oversight.
This fragmentation makes it challenging to identify recurring failure trends, standardize maintenance protocols, or consolidate service contracts with OEMs and specialized vendors.
In addition, inconsistent capital planning can lead to overlapping interventions, underutilized asset life, and inefficient allocation of depreciation schedules, thereby affecting key financial metrics such as ROCE, EBITDA, and TCO.
The economics of asset ownership are increasingly determined by long-term equipment maintenance intensity rather than initial capital cost.
Optimizing CAPEX MRO requires integrating predictive maintenance, digital monitoring systems, and structured capital planning.
By aligning MRO activities with asset criticality, operational schedules, and long-term depreciation strategies, organizations can reduce unplanned downtime, extend asset life, and achieve measurable financial returns on capital investment.
The table below illustrates reductions in maintenance costs, unplanned failures, and downtime, demonstrating the value of proactive CAPEX-related MRO strategies.
(Sources: Number Analytics, Oxmaint, MoldStud)
| Industry | Maintenance Cost Savings / ROI | Downtime / Efficiency Impact |
|---|---|---|
| Manufacturing | 8–12% reduction in maintenance costs vs traditional approaches | Up to 20–50% reduced unplanned downtime; OEE improvements reported |
| Aerospace | ~10% maintenance cost savings from predictive strategies | Reduced delays and improved reliability (e.g., specific OEM programs) |
| Automotive | ~9% maintenance cost savings | Example: 35% downtime reduction and ~$1M facility savings reported in case studies |
| Energy / Utilities | ~12–30% cost reduction and higher uptime | Predictive monitoring yields ~40% maintenance cost cut and 99%+ availability in field cases |
| Transportation / Aviation | Large absolute savings (e.g., $95 B industry‑wide) | Airlines report ~25–40% maintenance cost decrease with predictive analytics |
| Healthcare / Medical Equipment | Improve uptime and reduce failure events | MRI & critical device availability increases (e.g., 40% reduced downtime in studies) |
| Mining & Resources | Substantial annual gains (e.g., ~$38 B) | Higher equipment longevity and continuity of production |
Infrastructure Maintenance
Facility and utilities MRO costs are driven by HVAC systems, electrical infrastructure, plumbing, and building maintenance.
While these costs are often considered secondary to production equipment, failures in facility assets can disrupt operations and compromise safety.
A common driver of high costs in this category is reactive maintenance resulting from deferred upkeep. When facility assets are not systematically included in maintenance planning and condition monitoring programs, failures occur unexpectedly.
Emergency repairs then require expedited labor and materials, which cost significantly more than planned maintenance activities.
Additionally, facility MRO spend is often dispersed across multiple cost centers with limited analytical oversight, making it difficult to identify recurring failure patterns or consolidate service contracts across sites.
Safety and Personal Protective Equipment
PPE spending is mandatory in regulated industries, yet costs escalate due to lack of standardization and fragmented supplier bases.
Different sites often specify different brands or grades of PPE for similar roles, driven by local preferences rather than centralized standards.
This fragmentation prevents volume aggregation and leads to inconsistent pricing. While PPE items are low-value individually, the cumulative cost across large workforces is significant.
Moreover, poor tracking of issuance and replacement cycles can result in both over-issuance and shortages, each carrying operational and compliance risks.

The next step is to examine how these expenditures are recorded and managed across different cost centers.
Allocating MRO spend to the appropriate cost centers, such as production lines, maintenance departments, or specific facilities, provides visibility into where resources are consumed, highlights areas of inefficiency, and enables more accurate budgeting and performance tracking.
Understanding the intersection between spend categories and cost centers is essential for organizations aiming to optimize both operational reliability and financial performance.
Intangible MRO Costs
Besides physical parts and materials, MRO (Maintenance, Repair, and Operations) also involves intangible costs. These costs have a direct effect on asset reliability, how efficiently operations run, and how well long-term costs are managed.
Intangible areas such as Technical Services and Digital Infrastructure are important. They help organizations maintain their physical assets and also support better strategic decision-making.
Technical Services:
Technical services cover specialized labor and expertise required for maintaining, repairing, and optimizing assets.
These services are often delivered by third-party contractors, OEMs, or in-house experts and are critical for minimizing downtime and maximizing asset reliability.
Key Components of Technical Services:
- Reliability Engineering & Consulting: Experts provide guidance on asset management, failure analysis, and preventive strategies to avoid breakdowns.
- Inspections & Diagnostics: Routine and condition-based checks, like vibration analysis, thermal imaging, and oil analysis, identify early signs of failure to prevent unplanned downtime.
- Field Services & Maintenance Support: On-demand technical support for complex repairs, including turbine overhauls or automation diagnostics. Remote support via telemetry and digital twin technology is also common.
- Predictive Maintenance Programs: Leveraging data from sensors and diagnostic tools, predictive maintenance reduces unplanned downtime.
- Preventive Maintenance Execution: Scheduled inspections, replacements, and calibrations. Over-maintenance or poorly optimized schedules inflate labor and part costs without proportional reliability gains.
Below is a table that represents how different maintenance strategies affect MRO spend: (Sources: Stacker, Logicline, and OSTI)
| Maintenance Type | Cost Impact | Downtime Impact |
|---|---|---|
| Reactive | 2–4× higher long-term cost | High, due to emergency repairs |
| Preventive | Moderate recurring costs | Lower than reactive |
| Predictive | 15–25% cost reduction vs reactive | 30–50% downtime reduction |
These technical services represent a significant portion of total MRO cost, particularly in industries such as manufacturing, energy, oil and gas, and utilities, where equipment failure directly impacts safety, production, and regulatory compliance.
Industry benchmark show that
In a case where predictive maintenance was deployed across multiple food and beverage sites, documented savings from avoided downtime hours exceeded $28.9 million, with nearly 3,000 downtime hours avoided through analytics and condition monitoring.
Digital Infrastructure for MRO (EAM/CMMS)
Digital infrastructure, including Enterprise Asset Management (EAM), Computerized Maintenance Management Systems (CMMS), inventory management tools, MDM software solutions, and spend analysis platforms, has become indispensable for effective MRO management.
These tools help organizations manage the full lifecycle of assets by tracking:
-
Physical condition of equipment
-
Maintenance history and service schedules
-
Lifecycle costs including both tangible and intangible MRO spend
Key Cost Drivers:
- Software Licensing and Platform Proliferation: Multiple plants or business units often operate different EAM or CMMS instances.
- System Integration Gaps: Disconnected EAM, inventory, procurement, and finance systems prevent accurate alignment between maintenance demand and material availability leading to manual workarounds, and delayed maintenance execution.
- Spare Parts Master Data Complexity: Poor data governance results in duplicate part numbers, inconsistent descriptions, and obsolete items remaining active in systems.
Identical spare parts may be stocked under different IDs across sites, inflating inventory levels while still failing to guarantee availability.
The downstream impact includes higher warehousing, insurance, handling, and capital tied up in excess stock.
Here is how our AI agent helps in identifying the obsolete spare parts and helps in identifying the alternative parts and suppliers:
- Cross-Site Data Inconsistency:Lack of standardized data prevents effective rebalancing of spares and supplier consolidation, increasing logistics and expediting costs.
- Analytics, Data Management, and Change Enablement: Predictive maintenance tools require clean spare parts data (methods discussed in this article), governance, and training; poor adoption turns strategic investments into cost burdens.
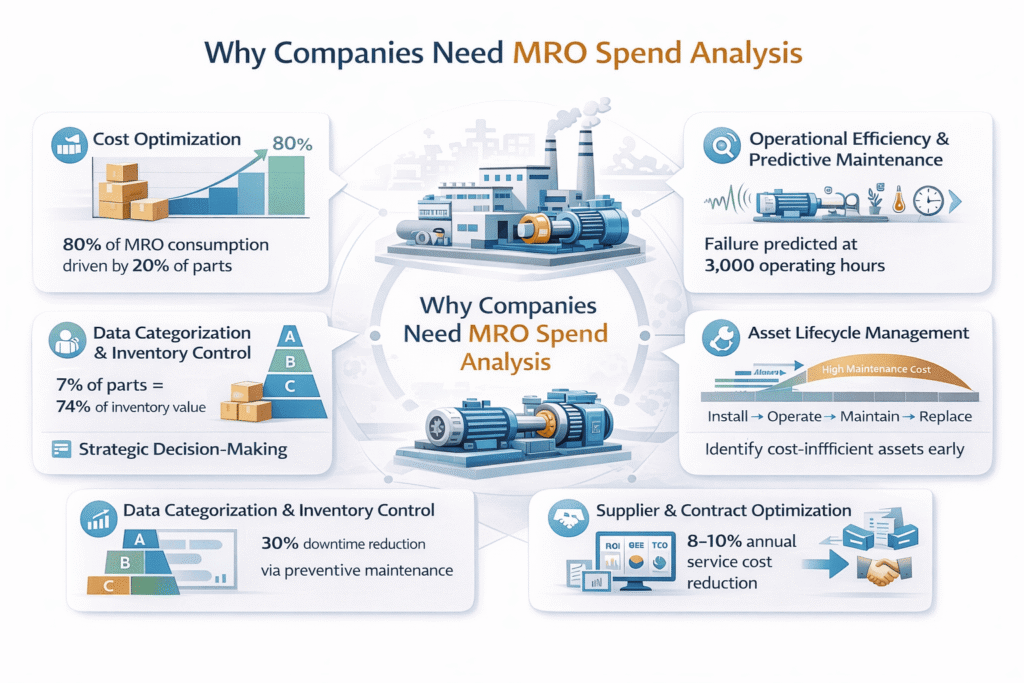
Why do Companies Need to Analyze their MRO Spend
MRO spend analysis is essential for companies operating asset-intensive environments because MRO costs are highly fragmented, operationally critical, and directly linked to asset reliability.
Without structured analysis, MRO remains reactive, cost-opaque, and difficult to control.
Below are the core technical reasons companies requiring MRO spend analysis:
Cost Optimization Through Data-Driven Insights
MRO inventory often represents a large hidden cost in manufacturing or industrial operations. Analysing MRO data can reveal:
1. High-consumption items: For instance, 80% of maintenance consumption might come from fast-moving items like ball bearings, while 20% comes from slower-moving parts like valves.
Knowing this allows companies to:
-
- Keep bulk stock for high-consumption items.
- Avoid overstocking low-demand parts.
2. Procurement efficiency: Using historical usage data, companies can negotiate better contracts, adopt bulk-buying, and define effective MRO procurement strategies that reduce unit costs and drive supplier performance improvements.
Example: A car assembly plant might track thousands of MRO SKUs. Data might show that 80% of machine failures are caused by worn bearings, leading the company to standardize suppliers and stock more efficiently.
Operational Efficiency and Predictive Maintenance
MRO analysis isn’t just about tracking inventory; it’s about keeping machines running. By analysing maintenance logs, sensor data, and part replacement history:
- Companies can predict failures rather than react to them.
- Maintenance schedules can be optimized to reduce downtime.
Example: An industrial air compressor might have sensors measuring vibration and temperature.
Analysis of historical MRO data shows that bearings wear out after 3,000 operating hours. The company can schedule pre-emptive bearing replacement, avoiding unexpected production halts.
Asset Lifecycle Management
MRO data allows for informed decisions on asset longevity and replacement:
- Tracking usage and replacement history helps determine when a machine is nearing end-of-life.
- Analysis of MRO consumption patterns across assets can identify high-maintenance machines that might be cost-inefficient to operate.
Example: If a chemical plant notices that certain pumps require valve replacements every 6 months while others last 2 years, they can prioritize upgrades for the high-maintenance pumps.
Data Categorization and Inventory Control
Effective MRO analysis depends heavily on structured data management and parts categorization in MRO. By systematically organizing parts, tools, and consumables, organizations can improve inventory control, reduce costs, and optimize maintenance operations.
Parts are often classified by consumption frequency, criticality, cost, lead time, and function. Among the various approaches (covered in this article), a common method is ABC analysis:
-
A-items: High-value or high-consumption items (e.g., ball bearings, electric motors)
-
B-items: Moderate consumption or value items (e.g., belts, filters, valves)
-
C-items: Low-consumption, low-value items (e.g., gaskets, fasteners)
Other classification criteria may include:
-
Criticality: Parts essential to safety or production continuity (e.g., pump seals, safety valves)
-
Lead time: Long-lead items requiring advance planning (e.g., specialty bearings)
-
Lifecycle stage: Parts nearing end-of-life or replacement cycles (e.g., legacy control modules)
For example:
In an oil and gas company, ABC classification of over 4,200 spare parts showed that a small percentage of parts (7%) accounted for a large portion (74%) of inventory value.
By focusing control and forecasting on these high‑value parts, the company could reduce average inventory investment and improve service levels, demonstrating how parts categorization drives cost savings and operational efficiency. (Source: Wisdom Library).
Strategic Decision-Making Through Analytics
With proper MRO data, companies can make strategic decisions:
- Identify which machines or parts are driving costs.
- Evaluate ROI of maintenance programs versus capital replacement.
- Benchmark performance against industry standards.
Example: Analysis might reveal that preventive maintenance on high-use ball bearings reduces downtime by 30%, justifying an investment in better-quality bearings or predictive sensors.
Supplier and Contract Optimization
Service and spare parts pricing often varies widely across sites and vendors. Spend analysis helps:
- Identify fragmented supplier bases
- Benchmark service rates and part prices
- Rationalize OEM vs third-party sourcing
This enables better contract structuring and long-term cost control.
Example: Rationalizing OEM and third-party vendors for critical spares reduced service costs by 8–10% annually while maintaining operational reliability.
Budget Predictability and Risk Reduction
Unplanned maintenance is one of the largest sources of cost volatility. MRO analysis:
- Improves forecasting accuracy
- Reduces emergency purchases and premium service costs
- Strengthens maintenance planning and budgeting
Linking MRO spend to failure modes allows companies to differentiate planned versus unplanned maintenance, improving reliability-centered maintenance (RCM) and overall equipment effectiveness (OEE).
Challenges in Managing MRO Spend
1. The Unstructured Nature of MRO Data:
Unlike direct materials, MRO data rarely adheres to clean master data standards.
Typical issues include:
- Free-text line-item descriptions
- Localized naming conventions at site level
- OEM part numbers mixed with distributor SKUs
- Language and abbreviation variance
- Inconsistent units of measure (EA vs. BOX vs. SET)
For Example: One physical part having different descriptions like “Ball Bearing 6205-2Z”, “6205 ZZ Bearing”, “SKF 6205ZZ”, “BRG-6205-2Z”
Here is how Verdantis’ Harmonize, helps enterprises in normalizing their MRO data through global and custom taxonomies, across all sites, giving your teams clear visibility and control over inventory and spend.
2. ERP Fragmentation and SKU Duplication:
Large industrial organizations often operate:
- Multiple ERPs (SAP ECC, S/4HANA, Oracle, Maximo, Infor)
- Site-level material masters
- Independent CMMS/EAM systems
This leads to problems like SKU duplication across plants, inconsistent material group assignments, no global part equivalency mapping.
Without a harmonized item master, spend visibility is fundamentally distorted.
3. Lack of Classification Standards:
MRO data often suffers from a lack of consistent classification standards. While two global taxonomies, UNSPSC and eClass, are widely recognized, in practice many MRO line items are either not classified at all or only categorized at very high levels (Level 1 or 2).
Such broad classifications are insufficient for detailed sourcing decisions or reliability analysis.
For example, UNSPSC 31171500 = Bearings tells you only that the item is a bearing, but provides no information about its criticality, associated assets, impact of failure, or interchangeability, all of which are essential for effective maintenance planning and procurement.
Our Verdantis MDM Suite features task-specific agents, including AutoClass, which streamlines data classification according to both global and tailored taxonomies.
4. Criticality Assessment:
A core challenge in MRO spend analysis is the lack of structured criticality assessment. Not all MRO items carry the same operational risk, yet many organizations treat them uniformly.
Key gaps include:
- No linkage between spare parts and asset criticality
- No differentiation between safety-critical, production-critical, and convenience spares
- Limited understanding of failure impact and downtime cost
Without criticality-based prioritization, organizations tend to overstock low-risk items while underestimating exposure to high-impact failures, leading to inefficient capital allocation and elevated operational risk.
5. Weak Linkage Between Spend, Maintenance Activities, and Assets:
A persistent challenge in MRO spend analysis is the absence of a strong, structured link between procurement data and maintenance execution data, which creates gaps like:
- Purchase orders not linked to work orders or equipment IDs
- Parts issued from stores without being associated to a specific asset
- Maintenance activities recorded without structured failure codes
Without this linkage, organizations cannot accurately determine which assets drive the MRO spend, whether the spend is preventive or reactive, and the actual cost of maintaining the individual assets.
This disconnects limits reliability-centered maintenance (RCM) and prevents spend analysis from translating into operational insight.
6. Planned vs. Unplanned Maintenance Spend Ambiguity
Many organizations struggle to distinguish between planned maintenance spend and emergency or breakdown-driven spend.
Contributing factors include:
- Emergency purchases booked under generic maintenance categories
- Lack of standardized maintenance activity codes
- Inconsistent treatment of contractor services versus spare parts
As a result, cost volatility remains high, and management lacks visibility into how much spend could have been avoided through better planning.
7. Inventory Obsolescence and Dormant Stock Visibility
While excess inventory is often recognized, true obsolescence is harder to identify due to poor data enrichment and asset linkage.
Typical issues include:
- Spare parts retained for decommissioned or upgraded equipment
- Low-usage items lacking last-used or last-issued dates
- No sunset or lifecycle status for MRO items
How Can Organizations Reduce their MRO Costs?
MRO (Maintenance, Repair, and Operations) costs represent the expenditures required to keep physical assets safe, reliable, and available for production.
Although MRO spend does not directly create end products, it has a direct and disproportionate impact on asset uptime, safety performance, and operating continuity.
Poorly managed MRO costs often manifest as excessive inventory, emergency purchases, higher Mean Time to Repair (MTTR), and unplanned downtime.
To control MRO costs without compromising reliability, organizations typically apply a combination of structural and operational reduction strategies:
Data Normalization and Inventory Rationalization
In global enterprises, data fragmentation is the primary barrier to visibility. A single component, such as a “Ball Bearing,” may be recorded as “Brg,” “6205 ZZ,” or a manufacturer-specific SKU across different ERP modules.
A well-maintained asset master ensures that each piece of equipment is correctly linked to its required spares.
Professional spend analysis begins with scrubbing and enriching this unstructured data, ensuring every transaction adheres to a unified taxonomy like UNSPSC or eClass.
Without this clarity, an organization cannot leverage its true aggregate purchasing power.
Here is how Verdantis’ AutoEnrich agent, helps enterprises in enriching their data through global and custom taxonomies:
Inventory rationalization is a critical step in controlling MRO costs, ensuring that spare parts, tools, and consumables are stocked efficiently based on usage patterns and asset criticality.
Structured MRO storeroom management ensures that parts, tools, and consumables are centrally tracked, issued against work orders, and replenished efficiently, reducing carrying costs and emergency purchases.
Professional spend analysis combines data normalization with lifecycle tracking in EAM/CMMS, which allows organizations to identify obsolete or duplicate SKUs, apply ABC/XYZ classification, and prioritize stocking of critical items.
Total Cost of Ownership (TCO) Oriented Procurement
Part cost alone does not reflect true maintenance expenditure. TCO-based sourcing considers failure impact, labor requirements, downtime, and asset longevity.
- Compare OEM versus aftermarket parts based on lifecycle costs, not just purchase price.
- Quantify indirect costs such as additional wrench time, repeat repairs, or collateral equipment damage.
- Integrate TCO metrics into supplier selection and contract negotiation.
Example: A mining operation switched to higher-quality conveyor belts with longer operational life. Although unit cost increased by 20%, total lifecycle cost decreased by 15% due to fewer replacements, reduced downtime, and lower labor effort.
Vendor Managed Inventory (VMI) and Collaborative Supply Models
VMI and collaborative replenishment models reduce holding costs and ensure part availability.
- Establish agreements with suppliers to manage high-usage consumables and fast-moving spares.
- Use real-time consumption data from EAM/CMMS to trigger replenishment.
- Monitor performance through KPIs such as fill rate, stock-outs, and lead-time compliance.
Example: A manufacturing site implemented VMI for lubricants and PPE. Inventory levels dropped by 30%, stock-outs were eliminated, and procurement administration workload decreased, freeing planners to focus on high-value spare parts.
Digital-Enabled Analytics and Continuous Improvement
Advanced analytics platforms are essential for sustained MRO cost management.
- Utilize EAM/CMMS dashboards to monitor spend, inventory, supplier performance, and maintenance efficiency.
- Implement predictive analytics to anticipate spare part demand, detect anomalies, and flag inefficiencies.
- Continuously refine inventory policies, sourcing strategies, and maintenance schedules based on data insights.
Example: A large petrochemical plant used predictive dashboards to identify low-usage high-cost items. Rationalizing these items and improving usage forecasts led to a 12% reduction in overall MRO spend while improving stock availability for critical assets.
Predictive and Condition-Based Maintenance Alignment
Aligning MRO spend with predictive maintenance initiatives prevents unnecessary part replacements and emergency sourcing.
- Integrate sensor data and historical failure patterns with maintenance scheduling.
- Plan spare part replenishment around expected failure windows to reduce express orders and idle stock.
- Track Mean Time Between Failures (MTBF) to optimize part lifecycle usage.
Example: A refinery used vibration and thermal monitoring to predict bearing failures in centrifugal pumps. Preemptive part replacement scheduling reduced unplanned downtime by 40% and cut premium labor costs associated with emergency repairs.
Conclusion
A comprehensive approach to MRO spend not only safeguards operational continuity but also drives informed decision-making across maintenance, procurement, and asset management functions.
By linking cost insights to asset criticality, lifecycle considerations, and supply chain dynamics, organizations can achieve a balance between efficiency, reliability, and strategic resource allocation, turning MRO from a reactive expense into a measurable contributor to long-term business performance.