

Enterprise Asset Management (EAM) is rapidly transforming from a maintenance support tool into a strategic business imperative.
As organizations grapple with aging infrastructure, rising operational costs, and the imperative for predictive maintenance, EAM adoption is surging across manufacturing, energy, utilities, and transportation sectors.
The following 20+ statistics, drawn from 2025-2026 industry research, market reports, and enterprise case studies, reveal the massive financial and operational impact of EAM.
These insights demonstrate how EAM delivers double-digit ROI, slashes unplanned downtime, optimizes inventory, and extends asset lifecycles—directly impacting profitability and resilience.
Market Growth, Technology Trends, and Strategic Opportunities
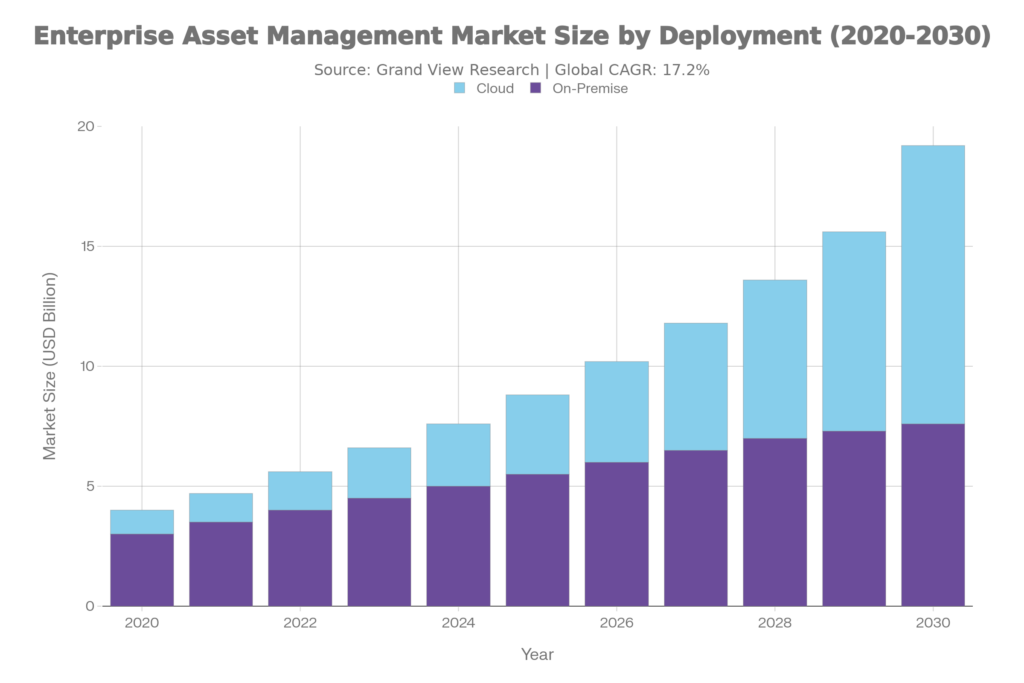
The global enterprise asset management market size was estimated at USD 7.65 billion in 2024 and is projected to reach USD 19.68 billion by 2030, growing at a robust CAGR of 17.2% from 2025 to 2030, as per Grand View Research .This surge is driven by a stronger emphasis on improving asset availability and reducing asset breakdowns that impair business operations.
While some conservative estimates place the market on a steadier path-for instance, Global Growth Insights forecasts a CAGR of 5.3% reaching ~USD 8.3 billion by 2034 Global Growth Insights-the prevailing industry sentiment reflects aggressive adoption of “Industry 4.0” technologies that support the higher growth narrative.
The global enterprise asset management (EAM) market is experiencing a period of explosive growth, driven by a fundamental shift in how organizations view their physical infrastructure. No longer just a cost center, asset management has become a strategic lever for profitability and resilience.
Understanding Enterprise Asset Management
According to IBM, EAM is the combination of software, systems, and services used to maintain and control an organization’s operational assets and equipment. The goal is to optimize the quality and utilization of assets throughout their lifecycle, increase productive uptime, and reduce operational costs.
Unlike a Computerized Maintenance Management System (CMMS), which primarily focuses on maintenance execution, EAM takes a holistic view. It integrates maintenance with supply chain, inventory, finance, and health, safety, and environment (HSE) protocols to optimize asset performance and reduce total cost of ownership (TCO).
Core Components of EAM:
- Asset Lifecycle Management – Tracking asset health, depreciation, and replacement planning
- Work Order Management – Automating maintenance requests and technician scheduling
- Supply Chain & MRO – Managing spare parts inventory to prevent stockouts or overstocking
- Environment, Health & Safety (EHS) – Ensuring compliance with regulatory standards
- Predictive Analytics – Leveraging data to forecast failures before they occur
- Mobile Enablement – Field technician access to work orders, asset histories, and real-time guidance


Market Growth: A $20 Billion Opportunity by 2030
- More conservative estimates project USD 5.87 billion in 2025 growing to USD 9.02 billion by 2030 at a 9.0% CAGR, reflecting sustained enterprise demand for asset optimization (Src: Marketsandmarkets)
- Asia Pacific leads growth at 18.5% CAGR, driven by rapid industrialization, smart infrastructure, and manufacturing expansion in China and India (Src: Precedenceresearch)
- North America holds 32-38% market share in 2024, fueled by utilities, manufacturing, and aging infrastructure renewal [Src: Mordorintelligence]
- According to Fortune Business Insights (Oct 2024), the market was valued at USD 6.09 billion in 2024, projected to grow from USD 6.65 billion in 2025 to USD 13.69 billion by 2032 exhibiting 10.9% CAGR. North America dominated with 36.95% share in 2024.
- Verified Market Research (Sep 2025) projects USD 9.5 billion in 2024 expanding to USD 27.02 billion by 2032 at 15.40% CAGR. The rapid growth underscores EAM’s strategic importance across industries.
- Research Nester (Sep 2025) valued the market at USion in 2025, estimating USD 7.73 bD 6.94 billillion in 2026 and reaching USD 22.74 billion by 2035 with 12.6% CAGR. Manufacturing drives the majority of adoption.
Deployment & Adoption Trends
- As per MarketsandMarkets, Manufacturing commands ~29% market share while Linear Assets (pipelines, rail) represent the fastest-growing asset class. Operations Management dominates EAM applications due to real-time workflow optimization.
Research and Markets (Dec 2024) confirms Large enterprises hold 60%+ market share due to complex, multi-site asset portfolios requiring enterprise-grade solutions.
According to Global Market Insights (Dec 2024), North America maintains ~36% global market share through 2026, driven by utilities and manufacturing leadership.
AI and Predictive Analytics in Enterprise Asset Management
The integration of Artificial Intelligence and Machine Learning into EAM represents a fundamental shift in how organizations manage assets. AI-driven systems enable:
Predictive Failure Forecasting: Machine learning models analyze historical data, sensor information, and operational patterns to forecast component failures weeks or months in advance, enabling proactive intervention.
Prescriptive Recommendations: Advanced systems recommend specific maintenance actions, parts requirements, technician assignments, and optimal maintenance windows based on production schedules and resource availability.
Schedule Optimization: AI algorithms balance maintenance needs with production schedules to minimize disruption, often identifying optimal maintenance windows that human planners would miss.
Natural Language Interfaces: Generative AI enables technicians to query manuals, asset histories, and diagnostic databases using conversational language, dramatically reducing training requirements and time-to-insight.
As per Verdantis research, clean spare parts master data reduces unplanned downtime by 50% through improved inventory optimization and part tracking. Automated data enrichment tools increase manufacturer name accuracy by 36% and part number accuracy by 16%, directly lowering operational costs and redundancy.
According to Siemens (2024), AI-driven predictive maintenance prevents $1.4 trillion in annual global downtime losses for top 500 companies. Automotive sector specifically avoids $2.3 million per hour in production losses through proactive failure forecasting.
Verdantis studies reveal 20% of components are superseded or obsolete before data cleansing intervention. Clean, standardized spare parts data eliminates duplicate inventory and prevents expensive redundant orders across MRO operations.
As per MarketsandMarkets (Dec 2025), 82% of organizations now require predictive maintenance capabilities as standard in EAM evaluations. AI/ML integration drives the shift from reactive to prescriptive asset management strategies.
Boston Consulting Group (2016) found proprietary OEM parts comprise 40-70% of machine replacements with limited alternatives. AI specification analysis identifies 5-20% cost reduction opportunities through alternative sourcing recommendations.
According to McKinsey, AI-optimized digital work order management reduces planned downtime costs 15-30%. Machine learning algorithms balance maintenance windows with production schedules, identifying optimal intervention timing missed by human planners.
Plant Engineering (2025) reports 40% of manufacturers now apply predictive EAM analytics alongside traditional preventive maintenance. Hybrid AI-human approaches deliver superior failure forecasting accuracy over standalone strategies.
As per Subex AI/ML EAM research (2024), predictive analytics reduces reactive maintenance costs by scheduling interventions based on actual asset degradation patterns. ML models process sensor data, historical failures, and operational context for weeks/months advance warnings.
Verdantis confirms predictive maintenance market grows 26.5% CAGR from USD 10.93 billion (2024) to USD 70.73 billion by 2032. This explosive growth validates AI’s transformation of enterprise asset management economics.
According to IBM Maximo documentation, generative AI natural language interfaces enable technicians to query asset histories, manuals, and diagnostics conversationally. This dramatically reduces training requirements and time-to-insight for complex repairs.
Financial Impact & MRO Optimization
Boston Consulting Group (2016) found robust MRO inventory management yields 15% improvement in spare parts inventories while preventing overstocking. The study documents a steel manufacturer reducing MRO spending 10% and transaction volume 25% through optimized planning.
The same BCG study reveals MRO spending ranges 0.5-4.5% of revenues across industries, with poor management causing high maintenance costs and excess inventory. Heavy manufacturing reports the highest MRO spend as percentage of revenue.
BCG (2016) identified proprietary parts comprising 40-70% of machine replacements sourced from single OEMs. Better specification management enables alternative sourcing for 5-20% cost reduction.
As per Siemens (2024), top 500 companies lose $1.4 trillion annually to unplanned downtime across industries. Automotive sector downtime specifically costs $2.3 million per hour, doubled since 2019.
Operational & Productivity Gains
McKinsey demonstrates digital work order management reduces planned downtime costs 15-30% through optimized shutdown planning. Maintenance tasks constitute 20-60% of operational expenditure, making EAM optimization mission-critical.
IBM emphasizes EAM reduces total cost of ownership (TCO) through comprehensive lifecycle management beyond reactive maintenance. The solution integrates asset performance with financial systems for strategic decision-making.
According to Plant Engineering (2025), 88% of manufacturers use preventive maintenance while 40% also apply predictive EAM analytics. This hybrid approach becomes the new industry standard.
Supply Chain & Inventory Metrics
Boston Consulting Group (2016) discovered 20% MRO spending dispersed among 1,600+ suppliers versus 80% concentrated in 250 suppliers. Long-tail purchasing drives 45% of transaction volume despite minimal spend.
The same BCG analysis documents pharmaceutical manufacturers achieving 15% throughput improvement through aggressive spare parts inventory management. Better availability eliminated production bottlenecks.
Strategic Business Impact
Technavio (Mar 2025) projects EAM market growth of USD 2.46 billion from 2024-2029 at 8.1% CAGR. Partnerships and vendor acquisitions accelerate innovation and market consolidation.
As per Future Market Insights (Nov 2025), EAM reaches USD 9.9 billion with 7.0% CAGR through 2035, driven by cloud migration and IoT integration.
Cognitive Market Research (2024) valued EAM at USD 3,731.79 million in 2022, projecting 9.1% CAGR through 2030 as enterprises prioritize asset visibility.
Regional & Vertical Leadership
Fortune Business Insights (2024) confirms North America dominated 36.95% market share in 2024 due to mature industrial base and regulatory requirements.
Precedence Research (Aug 2025) identifies Asia Pacific growing fastest at 14.3% CAGR fueled by manufacturing expansion and infrastructure investments.
Generic “one-size-fits-all” platforms are losing ground to specialized tools tailored to specific industries. Industry-specific EAM solutions are growing at 12.8% annually, significantly outpacing generalized platforms (8.6%) Market Business Insights, reflecting the critical need for domain-specific functionality.
Examples of Vertical Specialization:
- Manufacturing: Specialized modules for OEE (Overall Equipment Effectiveness) tracking, production line integration, quality management workflows, and predictive analytics for multi-spindle operations
- Energy & Utilities: Tools for managing thousands of miles of pipelines, power grids, distributed assets, and managing regulatory compliance (NERC, FERC requirements)
- Healthcare: Compliance and regulatory workflows tailored to medical device management, FDA traceability, biomedical engineering workflows, and patient safety protocols
- Transportation & Rail: Fleet management, preventive maintenance scheduling for vehicles and infrastructure, real-time tracking, and safety compliance
- Oil & Gas: Specialized modules for upstream/midstream/downstream asset management, risk-based maintenance, and HSE integration
Regional & Segment Analysis
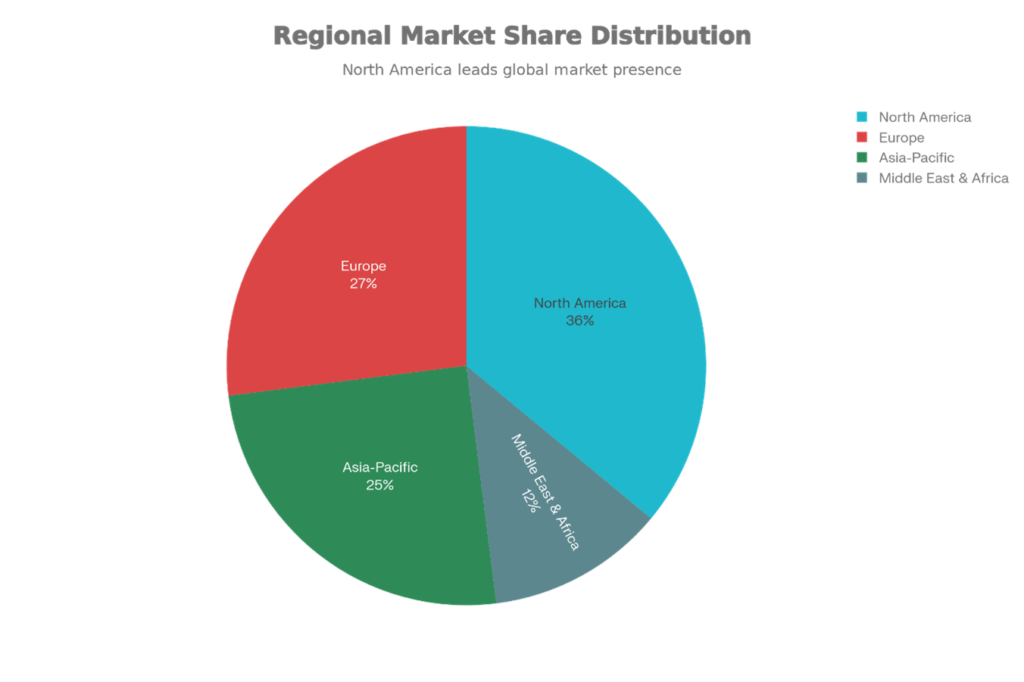
Region | Market Share (2024) | Growth Drivers | Key Characteristics |
North America | 36% | Utilities, manufacturing, regulations (OSHA/FDA) | 77% cloud adoption; 64% bi-directional financial integration [Market Business Insights] |
Europe | 27% | Industrial modernization, EU compliance, sustainability | Legacy renewal focus |
Asia Pacific | 25% | 18.5% CAGR – fastest growing; China/India industrialization [Market Business Insights] | Smart infrastructure, Industry 4.0 |
Middle East & Africa | 12% | GCC energy digitization | Oil & gas reliability focus |
- By Organization Size
Segment | Market Share | Investment Range | Key Characteristics |
Large Enterprises | 60% | $500K-$5M+ | Multi-site complexity, ERP integration (SAP/Oracle), 11-18 month ROI, AI/IoT focus |
Mid-Market | Growing | $100K-$500K | Cloud-first, phased rollouts, predictive capabilities |
Small Enterprises | Emerging | $20K-$50K/year | SaaS democratization, mobile-first simplicity |
- By Industry Vertical
Vertical | Market Share | Strategic Focus | Key EAM Requirements |
Manufacturing | 19% | OEE optimization | 20-30% cost reduction, ERP/MES integration, predictive maintenance |
Energy/Utilities | Major | Linear assets (pipelines, grids) | NERC/FERC compliance, renewable energy support |
Healthcare | Growing | Medical equipment | FDA/HIPAA compliance, zero downtime tolerance |
Transportation | Significant | Fleet management | Real-time GPS, just-in-time maintenance |
The EAM market balances comprehensive platforms from IBM, SAP, Oracle, Hexagon, and IFS (~45% combined share) with AI specialists like Verdantis, which delivers autonomous MRO super agents.
Market Leaders Overview
Vendor | Core Strength | Target Industries | Key Differentiator |
IBM Maximo | AI/IoT analytics | Aviation, utilities | Generative AI workflows |
SAP EAM | ERP integration | Manufacturing | SAP S/4HANA native |
Oracle EAM | Cloud scalability | Enterprises | OCI-native performance |
Hexagon HxGN | APM/lifecycle | Energy, transport | Predictive scheduling |
IFS Cloud | Field service | Oil & gas | Industry verticals |
ROI Timeline and Payback Period
The average ROI timeframe for comprehensive EAM implementations has decreased from 18 months to 11 months since 2022, driven by solution maturity, refined implementation methodologies, and faster cloud deployment Market Business Insights.
Key Financial Benefits:
- Maintenance Cost Reduction: 15–28% average reduction in total maintenance spending
- Unplanned Downtime Reduction: 23–37% average reduction in unexpected outages
- Asset Lifespan Extension: 20–40% longer useful life through consistent preventive care
- Inventory Optimization: 10–20% reduction in MRO stockholding costs
- Labor Productivity: 15–25% improvement in technician wrench time (time spent on actual work vs. administration)
ROI Calculation Framework
A typical implementation ROI can be calculated as:
ROI = (Downtime Avoided + Maintenance Savings + Inventory Savings + Productivity Gains) ÷ System Cost
For a mid-sized manufacturing facility:
- Downtime Avoided: USD 2–3M annually (24% reduction in unplanned outages)
- Maintenance Savings: USD 500K–800K annually (20% cost reduction)
- Inventory Optimization: USD 200–300K annually (15% reduction)
- Productivity Gains: USD 300–500K annually (20% increase in wrench time)
- Total Annual Benefit: USD 3–5M
- System Cost (Year 1): USD 300–500K
- Year 1 ROI: 600–1,600% (6–16x return)
Verdantis Approach to EAM
Enterprise Asset Management systems are only as effective as the data that powers them. Verdantis strengthens EAM initiatives by delivering clean, standardized, enriched, and governed asset and MRO master data, ensuring organizations get maximum value from their EAM investments.
Verdantis brings Agentic AI into Enterprise Asset Management, moving beyond static systems to autonomous, self-learning agents that continuously optimize asset performance, maintenance execution, and spare parts decisions.
Verdantis leverages AI to enable predictive maintenance, automate work orders and resource allocation, extract BOMs from unstructured documents, and normalize and enrich asset and spare parts data – resulting in 2 – 50% fewer unplanned shutdowns, up to 80% faster maintenance workflows, 36% higher data accuracy, and up to 30% inventory cost savings through seamless ERP and EAM integration.
How it works:
- Context-Aware Extraction:
AI agents intelligently parse unstructured data sources, such as equipment manuals, invoices, specification sheets, drawings and original equipment manufacturer (OEM) documents, thereby eliminating the need for manual data entry and reducing the risk of errors.
- Self-learning enrichment:
Extracted data is automatically classified and enriched using verified sources, industry taxonomies and standards such as UNSPSC, which improves accuracy continuously over time. - Autonomous execution:
Agents autonomously:
- create and prioritise work orders
- assign technicians based on skills and availability;
- trigger spare parts procurement and replenishment.
- Continuous optimisation:
They learn in real time from asset performance, production constraints, failure patterns and maintenance history, enabling ongoing optimisation without manual intervention.
Platform Integration & Spare Parts Intelligence:
Verdantis integrates seamlessly with leading EAM and ERP platforms including SAP EAM, IBM Maximo, Oracle, Infor, and Hexagon, ensuring smooth data flow across maintenance, inventory, and procurement systems.
Beyond integration, Verdantis delivers advanced spare parts intelligence, including:
Spare parts obsolescence detection to proactively identify risk and avoid downtime
Criticality assessment to prioritize high-impact assets and spares
Optimized stocking strategies aligned with asset criticality and maintenance demand
By combining Agentic AI, governed master data, and deep EAM integration, Verdantis transforms EAM from a reactive system into an intelligent, autonomous asset management platform – driving higher reliability, lower costs, and faster decision-making.
EAM Success Stories
80% reduction in paperwork/administrative overhead
50% improvement in real-time asset visibility
Contractor onboarding: 10 days → 2-3 days
40%+ inspector productivity increase
Automated workflows eliminated errors/downtime
- Successfully deployed to manage Mälartåg rail network
- Ensured uninterrupted passenger service with improved maintenance efficiency
- Seamless asset tracking across rail and bus fleets
- Future-ready platform supporting electric bus adoption and sustainability goals